
The Effect of Particulate Matter on Residential Electricity Consumption: An IV Analysis Using Wind Direction
Abstract
This study examines the effects of particulate matter (PM10, PM2.5) on residential electricity consumption using 2010 to 2021 city-level data from South Korea. To address potential endogeneity, an instrumental variable (IV) approach using prevailing wind direction as an exogenous source of variation in particulate matter concentrations is utilized. The first-stage results support the instrument's relevance. The second-stage estimates indicate that higher particulate matter concentrations increase per-capita residential electricity consumption. This finding suggests that individuals respond to air pollution through avoidance and adaptation behaviors, such as by using air purifiers, spending more time indoors, and reducing natural ventilation, all of which increase electricity demand. The results imply that air pollution is an important determinant of residential energy consumption. Moreover, increasing electricity use to mitigate exposure to pollution may necessitate additional energy production, potentially causing further environmental degradation. These findings highlight the need to integrate air quality and energy policies.
초록
본 연구는 2010년~2021년 대한민국 시・군 패널자료를 활용하여 미세먼지(PM10, PM2.5)가 가정용 전력 소비에 미치는 영향을 실증적으로 분석하였다. 잠재적 내생성 문제를 완화하기 위해 우세 풍향(Prevailing wind direction)을 미세먼지 농도의 외생적 변동 요인으로 활용한 도구 변수(IV) 분석을 시행하였다. 1단계 회귀분석 결과, 우세 풍향은 미세먼지 농도와 통계적으로 유의한 관련성(relevance)이 있는 것으로 나타났다. 2단계 추정 결과, 미세먼지 농도가 증가할수록 가정용 소비가 유의미하게 증가하는 것으로 분석되었다. 이는 공기청정기 가동, 실내활동 증가, 자연환기 감소 등 대기오염 회피・적응 행동(pollution-avoidance and adaptation behaviors)이 전력수요를 확대함을 시사한다. 본 연구 결과는 대기오염이 가정의 에너지 소비행태에 영향을 미치는 중요한 요인 중 하나라는 것을 보여주며, 대기오염 노출을 줄이기 위한 전력 사용 증가는 추가적인 에너지 생산을 유발하여 오히려 대기오염을 심화시킬 수 있음을 지적한다. 따라서 본 연구는 대기질 관리 정책과 에너지 정책을 통합적으로 고려하는 정책적 접근이 필요하다는 점을 제안한다.
Keywords:
Particulate Matter, Residential Electricity Consumption, Pollution-avoidance and adaptation behaviors, Instrumental Variables(IV) Analysis키워드:
미세먼지, 가정용 전력 소비, 오염 회피 및 적응 행동, 도구 변수(IV)분석I. Introduction
Air pollution resulting from particulate matter (PM) generated by fossil fuel-based industrial activities, including petroleum and coal combustion, and vehicle exhaust, poses a significant threat to public health and the environment. The International Agency for Research on Cancer (IARC) of the World Health Organization (WHO) has classified fine particulate matter as a Group 1 carcinogen, indicating that sufficient evidence of carcinogenicity in humans exists (IARC, 2013). This classification has contributed to heightened public awareness and concern regarding particulate matter pollution. As such concerns have grown, individuals have become more attentive to air quality and the potential health risks of exposure to atmospheric pollution. South Korea has experienced rising air pollution levels due to domestic sources and transboundary pollution originating in neighboring countries such as China and Mongolia. In response, the South Korean government has enacted a comprehensive air quality management policy, including its “Particulate Matter Management Policy,” to reduce particulate matter concentrations and associated health risks. These initiatives place particular emphasis on protecting vulnerable populations, such as children, elders, and individuals with existing respiratory diseases, while incorporating input from experts and society-based organizations. Additionally, the South Korean government monitors PM levels and sends disaster text messages to the public when PM concentrations exceed thresholds.
As environmentally stressful exposures, such as inhaling pollutants and PM-induced eye irritation, become more severe, individuals are expected to engage in various avoidance and adaptation behaviors to reduce their exposure and mitigate adverse health effects. The representative adaptation mechanism is to remain indoors, thereby altering residential energy consumption patterns. Specifically, this may increase electricity use due to operating air purifiers, air conditioners, and other indoor environmental control devices, while reducing natural ventilation and increasing time spent indoors during periods of degraded air quality. Notably, contracted residential electricity consumption can serve as an indicator of responses to air-pollution exposure.
Much of the literature documents that air pollution negatively affects major socioeconomic indicators, including labor productivity, physical activity, retail sales, and health status. However, relatively little research has examined how contracted residential electric usage responds to deteriorating air quality. Notably, the pattern of electricity use may shape behavioral responses and contribute to increased electricity demand driven by avoidance behavior. It may also impose additional pressure on energy systems and lead to further environmental externalities through increased electric generation. Given the economic and societal effects of air pollution, it is necessary to consider both mitigation policies to reduce pollutant emissions and avoidance and adaptation behaviors in indoor settings.
This study examines how particulate matter concentrations affect contracted residential electricity consumption in South Korea. To conduct the analysis, a panel data set including administrative cities spanning January 2010 to December 2021 is used. It combines monthly contracted residential electricity consumption values with PM levels and meteorological condition values measured at monitoring stations. Correlations between pollution levels and unobserved factors make it difficult to identify any effects, so to address endogeneity, this study employs an instrumental variable (IV) approach that exploits exogenous variation in particulate matter concentrations driven by prevailing wind directions. Notably, wind direction is instrumental in estimating PM's effects on residential electricity consumption.
Ⅱ. Literature Review
Rapid economic growth, industrialization, and urbanization have harmed air quality in many countries, with adverse consequences for human health, visibility, and climate. Li, Fang, Wang, and Sun (2016) argue that without effective environmental regulations and pollution control policies, continued industrial development will intensify PM pollution over the long term.
PM (particulate matter) refers to a mixture of solid particles and liquid droplets suspended in the air. Generally, it is too small to be seen with the naked eye and can only be detected using specialized instruments such as electron microscopes; however, some forms, including dust, dirt, and smoke, are visible. PM is classified into two categories based on size. PM10 refers to inhalable particles with an aerodynamic diameter of less than 10 micrometers, whereas PM2.5 denotes finer PM with a diameter of 2.5 micrometers or smaller. These remain suspended in the atmosphere for extended periods and are transported over long distances, contributing to numerous diseases and reducing life expectancy.
Recent studies suggest that particulate matter composition and size vary substantially across locations and through time, and that particle composition, in addition to particle size, plays an important role in determining health effects. The adverse effects of PM exposure on human health have been well documented, and research on the relationship between particle size and health outcomes continues to evolve (Harrison and Yin, 2000).
Particle size is closely linked to its potential health effects (Kim, Kabir, and Kabir, 2015). Smaller particles are more difficult to filter and can penetrate deeper into the human body, posing greater health risks. In addition to its effects on human health, PM concentration also affects visibility and climatic conditions. Because PM pollution is closely linked to broader issues such as energy production and economic development, addressing it requires an integrated approach that involves multiple disciplines, including environmental scientists, public health researchers, and medical professionals (Davidson, Phalen, and Solomon, 2005).
However, such responses may generate unintended environmental consequences. When air pollution levels increase, individuals often adopt avoidance or adaptation behaviors to reduce their exposure. Notably, actions that reduce vulnerability to environmental risks but ultimately worsen environmental conditions are often described as maladaptation (Juhola, Glaas, Linnér, and Neset, 2016). At the household level, individuals may reduce their PM exposure by remaining indoors. This increases indoor activities such as using air conditioners and operating air purifiers. Additionally, severe PM pollution can reduce visibility, leading households to increase their use of indoor lighting (CEPA, 2018). These behavioral responses raise energy demand and associated emissions, potentially exacerbating environmental problems.
Atmospheric pollution tends to alter electricity consumption patterns. He, Liang, Qiu, Li, and Xing (2020) assess co-damage using customer-level daily and hourly electricity data from Arizona and find that PM pollution increases electricity consumption in residential buildings and in the retail and recreational service industries. Additionally, estimates of household energy consumption in response to air pollution indicate that energy use increases by 11.2% for each 75 μg/m3 increase in PM2.5 levels (Eom, Hyun, Lee, and Lee, 2020). These findings suggest that air pollution affects household energy use through avoidance and adaptation behaviors, highlighting the channel through which environmental quality affects energy demand.
This study contributes to the existing literature in several ways. First, it provides evidence from South Korea, where PM pollution has been considered a disaster and air quality management policies have been actively implemented. Second, using a nationwide panel data set that includes administrative cities, it provides representative evidence based on broad geographic coverage. Third, it utilizes an instrumental variable analysis that uses prevailing wind direction to identify the effects of PM on residential electricity consumption. Finally, the study demonstrates that households' avoidance and adaptation behaviors in response to air pollution may increase electricity demand, potentially placing additional pressure on the electricity supply system. These findings provide additional empirical evidence that households respond to air pollution by increasing electricity consumption, highlighting an important relationship between air quality and energy demand.
Ⅲ. Data
This study uses city-level residential electricity consumption data spanning January 2010 to December 2021 provided by the Korean Electric Power Corporation (KEPCO). Electricity consumption is categorized by contract type, such as residential, educational, industrial, agricultural, and street lighting. Pollution avoidance and adaptation behaviors are conducted by the primary agents who consume electricity for contracted residential uses; therefore, this study focuses on residential electricity consumption. As shown in Figure 1, residential electricity usage steadily increased from 2010 to 2021, with total electricity consumption increasing from 63.3 to 81.1 million MWh, representing a 28% increase. This upward trend indicates increasing demand for household electricity, reflecting changes in household appliance usage, indoor activities, and residential energy usage patterns.
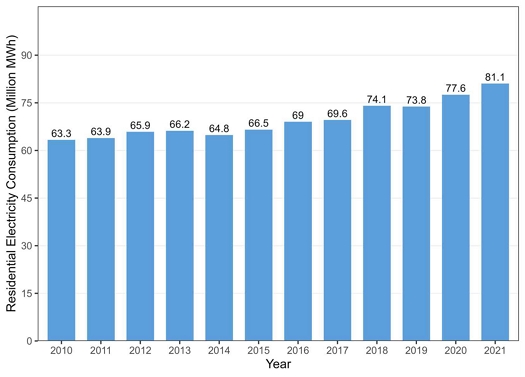
Residential Electricity Consumption in South KoreaSource: EPSIS (2026)
PM10 and PM2.5 data are collected from air pollution monitors operated by the Korean Environment Corporation (K-eco). City-monthly PM data are constructed by averaging the concentrations measured at all monitoring stations within each city. The database is used to identify and understand city-level trends in air pollution levels. The particulate matter concentration has been continuously reported from AirKorea. Figure 2 illustrates the annual PM10 and PM2.5 trends in South Korea. Both PM concentrations have declined over time, with a notable reduction after 2018. PM10 decreased from 47.5 to 36.2 μg/m3, while PM2.5 decreased from 25.6 to 18.1 μg/m3. The variation in PM levels across cities and over time allows the analysis to capture differences in local and long-term air pollution trends.
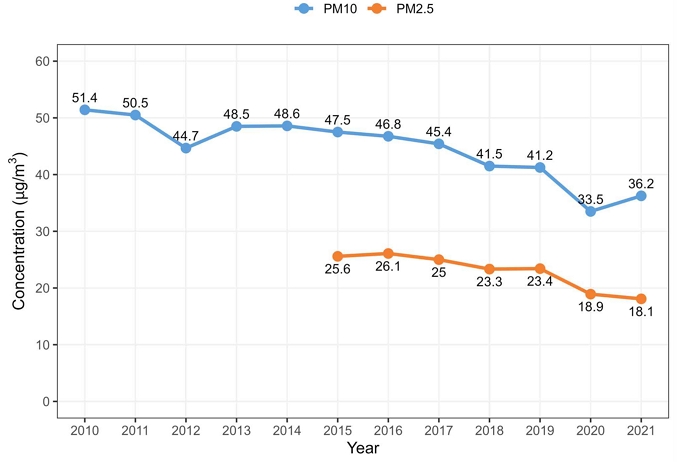
Trends in Annual Average PM10 and PM2.5 ConcentrationsSource: AirKorea(2026)
This study uses a weather database constructed from data obtained through the Korea Meteorological Administration (KMA) national weather monitoring network. The database includes temperature, total precipitation, wind direction, and wind speed. Monthly weather data are calculated at the city level from daily station-level data and are used for analysis. The study controls for atmospheric variables that affect electricity usage and air pollution levels, such as cooling degree days (CDD), precipitation, wind speed, and sunshine duration. In particular, this study uses the prevailing wind direction, defined as the direction from which wind enters each city from surrounding areas, as an instrumental variable to address potential endogeneity and explain variation in PM (PM10 and PM2.5). The directions of prevailing winds are grouped into eight categories (N–NW) based on geographical location. Figure 3 shows the percentage distribution of prevailing wind directions in Seoul and Incheon. Both cities are primarily affected by westerly winds (W, NW, and SW), and can be affected by both domestic and foreign air pollution sources.
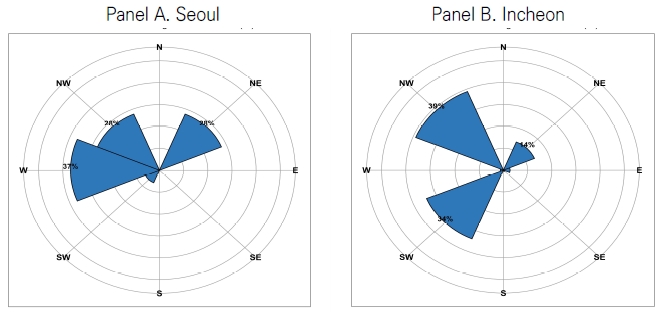
Distribution of Prevailing Wind DirectionsSource: Korea Meteorological Administration (KMA)
Table 1 presents descriptive statistics for the variables used in the analysis. Average per capita residential electricity consumption was 0.11 MWh per month. The mean concentrations of PM10 and PM2.5 were 40.80 and 9.47 μg/m3, respectively, with standard deviations of 14.46 and 5.91 μg/m3, respectively. This indicates substantial variation in air pollution levels across cities and over time. Additionally, this study uses CDD as a measure of cooling demand rather than temperature. The relationship between temperature and electricity consumption is nonlinear, and CDD provides a more reasonable measure of temperature-driven cooling demand. The average precipitation, wind speed, and sunshine duration were 114.87 mm, 14.66 m/s, and 191.42 hours, respectively, and population was used to account for heterogeneity across cities, including urbanization and demographic factors. The prevailing wind direction is categorized into eight directions and represented by a dummy variable to provide exogenous variation.

Descriptive Statistics
Ⅳ. Methodology
This study utilizes instrumental variable (IV) analysis to estimate the effects of PM (PM10 and PM2.5) on contracted residential electricity consumption. To address endogeneity-related bias, it uses prevailing wind direction as an instrument to isolate exogenous variation in PM concentrations and identify the effects of air pollution on electricity usage. Notably, wind direction is associated with air pollution concentrations but not with changes in electricity consumption. The IV strategy using wind direction has been used to identify the effects of air pollution on health and energy outcomes, exploiting changes in wind direction to generate plausible exogenous variations in PM levels (Deryugina, Heutel, Miller, Molitor, and Reif, 2019; He et al., 2020).
| (1) |
where Pollutionp indicates the atmospheric concentration of PM10 or PM2.5 by city i and month t, and WindDirectionkit represents prevailing wind direction indicators, excluding the reference direction (i.e., South). The coefficient of interest in the first-stage regression, πk, captures the association between prevailing wind direction and air pollution (PM10 or PM2.5). It indicates that the wind direction is a relevant predictor of local air pollution and supports the relevance of instrumental variables. The vector X′it includes meteorological variables, specifically CDD, precipitation, wind speed, and sunshine duration. It also includes population to control for differences in socioeconomic characteristics across cities. Large cities tend to exhibit greater levels of economic activity, urbanization, energy demand, and pollution exposure, all of which can influence residential electricity usage. Additionally, μm and λy denote month and year fixed effects, respectively. These time fixed effects control for seasonal variation and nationwide shocks that affect PM concentration and electricity consumption over time. νit is the error term in the first-stage regression.
A second-stage regression is conducted to estimate the association between PM concentration and residential electricity consumption. The estimated PM10 or PM2.5 values generated by wind direction isolate the variation in air pollution attributable to exogenous changes in wind patterns. This reduces potential endogeneity concerns arising from omitted variables, measurement errors, and reverse causality. Therefore, the second-stage estimates rely on PM concentration variations induced by prevailing wind direction rather than on variations arising from local economic activity or other confounding factors.
The empirical specification for the second-stage estimation is presented in Equation (2).
| (2) |
The dependent variable, ln(Electricityit), is the logarithm of per capita residential electricity consumption in city i and month t. The logarithmic transformation reduces skewness in the distribution of electricity consumption and facilitates interpreting the estimated coefficients in percentage terms. The parameter of interest, β1, measures the percentage change in residential electricity usage associated with a one-unit (μg/m3) increase in PM concentration. Notably, higher PM concentrations increase residential electricity consumption through avoidance and adaptation behaviors (Salvo, 2020; Wei, Xu, and Kuang, 2023). During episodes of high atmospheric pollution, individuals tend to spend more time indoors and increase the use of air conditioners, air purifiers, ventilation systems, and other household appliances to reduce exposure to outdoor air pollution. Additionally, households may reduce natural ventilation by keeping windows closed and relying more on mechanical cooling and air-cleaning devices. As a result, deteriorating air quality is expected to increase residential electricity demand.
The second-stage regression includes the same set of meteorological controls (CDD, precipitation, wind speed, and sunshine duration) and socioeconomic controls (population) as in Equation (1). Month and year fixed effects are included to account for seasonal variation, long-term time trends, and changes in electricity prices, which vary over time and may affect residential electricity consumption independently of air pollution. ϵit denotes the error term that captures unobserved determinants of residential electricity consumption that are unaccounted for by the model. This identification strategy allows the analysis to isolate the effects of air pollution on residential electricity consumption while controlling for other confounding factors that may simultaneously affect both variables.
Ⅴ. Results
1. First-Stage Results
Table 2 presents the first-stage regression results that estimate the association between prevailing wind direction and PM concentration. The wind direction is categorized into eight cardinal directions with South serving as the reference. The results indicate that the wind direction is a significant predictor of local PM concentrations, supporting the relevance of the instrumental variables.
First-Stage Regression Results
Column (1) in Table 2 shows that the PM10 concentration is statistically significant with several wind directions relative to the South direction. Winds blowing from the Northeast, East, Southwest, and West are associated with higher PM10 concentrations. The estimated coefficients shown in column (1) indicate that PM10 concentration increases by 2.35 μg/m3 under West winds, 1.039 μg/m3 under Northwest winds, 2.45 μg/m3 under Southwest winds. The effects of Southwest and West winds are especially large and are statistically significant at the 1% level.
Based on column (2) in Table 2, the prevailing wind direction is also strongly associated with fine PM concentrations. Prevailing winds blowing from six cardinal directions (Northeast–Southeast) are significantly related to PM2.5 concentrations. Compared with the reference wind (South), Northeast and Northwest winds are associated with increases in PM2.5 concentrations of 1.53 μg/m3 and 1.30 μg/m3, respectively. Additionally, Southeast winds are associated with a 1.23 μg/m3 increase in PM2.5 levels.
The first-stage F-statistics are 32.15 for PM10 and 32.36 for PM2.5, thus exceeding the conventional threshold of 10 and indicating that the wind directions are sufficiently strong instruments (Andrews, Stock, and Sun, 2019; Staiger and Stock, 1997). These findings support that prevailing wind patterns generate substantial variation in PM (PM10 and PM2.5) across cities and over time. These findings also provide a source of exogenous variation for the instrumental variable analysis.
Among the control variables, CDD is positively associated with both PM10 and PM2.5 concentrations, suggesting that PM levels tend to increase during periods with greater cooling demand. In contrast, wind speed shows a negative relationship with both PM types. This indicates that stronger winds accelerate the dispersion of pollutants. Precipitation is also negatively associated with PM2.5 levels, while sunshine duration is not statistically significantly associated with PM2.5 levels. Population is positively associated with PM2.5 concentrations, suggesting that more populous cities tend to experience higher PM2.5 levels.
2. Second-Stage Results
Table 3 provides the estimated effects of PM10 concentration on residential electricity consumption. To compare the significance and magnitude of estimates across statistical methods, this study shows both ordinary least squares (OLS) estimates and IV estimates using predicted PM10 in the first-stage regression.
Effect of PM10 pollution on Electricity Consumption
As shown in columns (2) using preferred specification, the OLS estimates show a positive and statistically significant relationship between PM10 concentration and electricity consumption. Specifically, a 1 μg/m3 increase in PM10 concentration is associated with a 0.1% increase in per-capita residential electricity consumption.
Notably, the IV estimates are larger than their OLS counterparts. In the preferred specification, which includes time fixed effects (column 4), the estimated coefficient on PM10 is 0.006 and statistically significant at the 5% level. This suggests that a 1 μg/m3 increase in PM10 concentration is associated with a 0.6% increase in residential electricity consumption. This finding indicates that worsening air quality contributes to greater residential electricity demand. The specification also accounts for meteorological and socioeconomic factors. Specifically, total precipitation, sunshine duration, and population are positively associated with residential electricity consumption, while the effects of CDD and wind speed are not statistically significant in the preferred PM2.5 specification.
The larger IV estimate implies that the OLS method may underestimate the effects of air pollution on electricity usage. The OLS estimate can be attenuated due to measurement errors and unobserved confounding factors (Habibov, Auchynnikava, Luo, and Fan, 2019; Huang and Sudhir, 2020). By isolating exogenous variation in PM10 concentration driven by prevailing wind direction, the IV analysis identifies a stronger effect of PM10 concentration on residential electricity demand.
To interpret the economic significance of the instrumental variable estimate, a one-standard-deviation increase in PM10 concentration (14.46 μg/m3) is associated with a 9.1% increase in electricity consumption. This finding reveals that individuals increase their electricity consumption when exposed to elevated PM10 levels.
Table 4 presents the estimated effects of PM2.5 concentration on residential electricity usage. As shown, OLS and IV analyses were conducted, and the estimates are reported regardless of whether fixed effects are included.
Effect of PM2.5 pollution on Electricity Consumption
The OLS results reveal a positive and statistically significant relationship between PM2.5 concentration and residential electricity consumption. Based on column (2), a 1 μg/m3 increase in PM2.5 level is associated with a 0.2% increase in electricity consumption.
Column (4) reports the IV estimate of the effect of PM2.5 level on residential electricity usage, suggesting that a 1 μg/m3 increase in PM2.5 pollution is associated with a 1.3% increase in electrical usage by contracted households. The IV estimate represents a substantially larger effect of PM2.5 on electricity demand compared to the OLS estimate. This pattern is similar to Table 3, where the OLS estimate may underestimate measurement error and omit factors correlated with both PM and electricity usage. To calculate the magnitude of the estimated effect, a one-standard-deviation increase in PM2.5 levels (5.91 μg/m3) is associated with a 7.7% increase in residential electricity consumption.
The estimates of the control variables in column (4) are consistent with expectations. CDD, precipitation, and sunshine duration are positively associated with residential electricity consumption, underscoring the importance of meteorological conditions in shaping household electricity demand. Nevertheless, the estimated effect of PM2.5 remains statistically significant after controlling for these meteorological and demographic factors.
Compared with the preferred PM10 estimates (0.006) reported in column (4) of Table 3, the effect of PM2.5 (0.013) is substantially larger. This magnitude difference is reasonable given the PM10 and PM2.5 particle sizes. Fine PM (PM2.5) poses greater health risks because it can penetrate more deeply into the respiratory and cardiovascular systems (Brunekreef and Forsberg, 2005; Xing, Xu, Shi, and Lian, 2016). As a result, households respond more aggressively to elevated PM2.5 levels by increasing their use of air purifiers, mechanical ventilation systems, and other electricity-intensive appliances.
Consequently, this finding suggests that fine PM pollution can meaningfully increase residential electricity demand through household avoidance and adaptation behaviors.
3. Electricity Consumption across PM Exposure Levels
The study estimates the percent changes of electricity consumption across particulate matter levels. Figure 4 shows the estimated percentage change in electricity consumption due to PM10 and PM2.5. Estimates are obtained from regressions that control for meteorological, socioeconomic, and time fixed effects, with the lowest pollution range (0–3 μg/m3) used as the reference group.
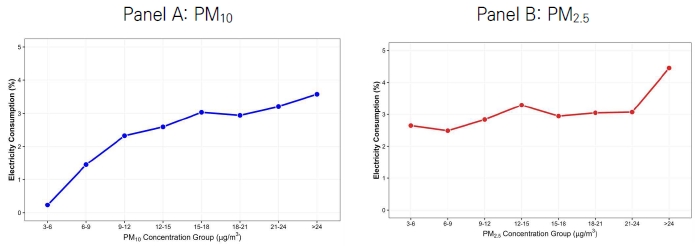
Electricity Consumption Changes across PM Exposure LevelsSource: Author's estimation results.
Panel A shows the association between electricity consumption and changes in PM10 concentration across the range of PM10 concentrations. Residential electricity consumption increases as PM10 levels increase. Compared to the reference group (0–3 μg/m3), households exposed to PM10 levels between 3 and 6 μg/m3 tend to consume 0.2% more electricity. The estimated change gradually increases across exposure groups, reaching approximately 3.6% when PM10 levels exceed 24 μg/m3. These findings suggest that deteriorating “coarse” PM10 pollution is associated with increased residential electricity demand.
Panel B presents the corresponding estimates for PM2.5 concentration groups. The estimated results are similar, but a stronger pattern is observed. Relative to the lowest exposure group (0–3 μg/m3), residential electricity consumption increases by 2.6% in the 3–6 μg/m3 category and continues to increase as PM2.5 concentrations worsen. The largest effect is observed in the highest exposure category (24 μg/m3), where electricity consumption is 4.5% higher than in the reference group. This result suggests that households respond more strongly to elevated levels of fine PM (PM2.5).
According to Figure 4, the increase in electricity consumption associated with PM2.5 exposure is consistently greater than that associated with PM10 exposure across most PM categories. This finding is consistent with the main IV results reported in Tables 3 and 4 and suggests that fine PM (PM2.5) generates stronger behavioral responses associated with household electricity demand. This is because PM2.5 can easily penetrate deep into the respiratory system and threaten health. Households are more likely to engage in avoidance behaviors that require electricity, such as staying indoors, and increasing the use of air purifiers, air conditioning, lighting, and ventilation systems. Consequently, the relationship between air pollution and residential electricity consumption appears to be more pronounced for PM2.5 than for PM10.
Ⅵ. Conclusion
This study estimates the effect of particulate matter pollution on residential electricity consumption in South Korea. It uses city-month-level panel data from 2010 to 2021 to estimate the association and controls for meteorological and socioeconomic variables. To address the endogeneity problem, it utilizes an instrumental variable (IV) analysis, with prevailing wind direction as an instrument for local PM concentrations.
The findings reveal that higher PM levels lead to increased residential electricity use. The IV estimates suggest that a 1 μg/m3 increase in PM10 level increases residential electricity consumption by 0.6%, while a 1 μg/m3 increase in PM2.5 level increases residential electricity consumption by 1.3%. To calculate the magnitude of the effects, a one-standard-deviation increase in PM10 and PM2.5 concentrations increases residential electricity use by 9.1% and 7.7%, respectively. Additional analyses indicate that electricity consumption increases across higher pollution groups and that the magnitude of association is stronger for PM2.5 than for PM10.
This study suggests that the economic consequences of air pollution include effects on residential energy demand. Therefore, improvements in atmospheric quality may yield benefits by reducing electricity consumption and associated energy expenditures. From the policymaker’s perspective, evaluations of air pollution control policies should consider not only health benefits but also the energy-related benefits that result from behavioral responses that improve air quality.
The study has several limitations. First, although it examines the relationship between PM concentrations and residential electricity consumption, a fully causal interpretation remains limited. Instrument strength is assessed using the conventional first-stage F-statistic because the Cragg–Donald F-statistic could not be applied to the current model. Second, the analysis is conducted at the city-month level due to data limitations that restrict the estimates' ability to capture heterogeneity across household characteristics. Future research could use daily or real-time household-level data, together with atmospheric inversion layer data, to examine how avoidance behaviors vary across housing types and income levels, contributing to differentiated energy welfare policies. Despite these limitations, this study provides additional evidence that air pollution contributes to increased residential electricity demand and provides a broader view of the link between environmental quality and energy consumption.
References
-
Andrews, I., J. H. Stock, and L. Sun, 2019, “Weak instruments in instrumental variables regression: theory and practice,” Annual Review of Economics, 11(1), pp.727-753.
[https://doi.org/10.1146/annurev-economics-080218-025643]

-
Brunekreef, B. and B. Forsberg, 2005, “Epidemiological evidence of effects of coarse airborne particles on health,” European Respiratory Journal, 26(2), pp.309-318.
[https://doi.org/10.1183/09031936.05.00001805]
- California Environmental Protection Agency(CEPA), 2018, “Tiny particles in the air can cause health effects,” California Air Resources Board Factsheet.
-
Davidson, C. I., R. F. Phalen, and P. A. Solomon, 2005, “Airborne particulate matter and human health: a review,” Aerosol Science and Technology, 39(8), pp.737-749.
[https://doi.org/10.1080/02786820500191348]
-
Deryugina, T., G. Heutel, N. H. Miller, D. Molitor, and J. Reif, 2019, “The mortality and medical costs of air pollution: evidence from changes in wind direction,” American Economic Review, 109(12), pp.4178-4219.
[https://doi.org/10.1257/aer.20180279]
-
Eom, J., M. Hyun, J. Lee, and H. Lee, 2020, “Increase in household energy consumption due to ambient air pollution,” Nature Energy, 5(12), pp.976-984.
[https://doi.org/10.1038/s41560-020-00698-1]
-
Habibov, N., A. Auchynnikava, R. Luo, and L. Fan, 2019, “A healthy weight improves life satisfaction,” International Journal of Health Planning and Management, 34(1), pp.396-413.
[https://doi.org/10.1002/hpm.2672]
-
Harrison, R. M. and J. Yin, 2000, “Particulate matter in the atmosphere: which particle properties are important for its effects on health?,” Science of the Total Environment, 249(1-3), pp.85-101.
[https://doi.org/10.1016/S0048-9697(99)00513-6]
-
He, P., J. Liang, Y. Qiu, Q. Li, and B. Xing, 2020, “Increase in domestic electricity consumption from particulate air pollution,” Nature Energy, 5(12), pp.985-995.
[https://doi.org/10.1038/s41560-020-00699-0]
-
Huang, G. and K. Sudhir, 2020, “The causal effect of service satisfaction on customer loyalty,” Management Science, 67(1), pp.317-341.
[https://doi.org/10.1287/mnsc.2019.3549]
- International Agency for Research on Cancer(IARC), 2013, “Outdoor air pollution a leading environmental cause of cancer deaths,” Press Release No. 221.
-
Juhola, S., M. Glaas, B. O. Linnér, and T. S. Neset, 2016, “Redefining maladaptation,” Environmental Science & Policy, 55, pp.135-140.
[https://doi.org/10.1016/j.envsci.2015.09.014]
-
Kim, K. H., E. Kabir, and S. Kabir, 2015, “A review on the human health impact of airborne particulate matter,” Environment International, 74, pp.136-143.
[https://doi.org/10.1016/j.envint.2014.10.005]
-
Li, G., C. Fang, S. Wang, and S. Sun, 2016, “The effect of economic growth, urbanization, and industrialization on fine particulate matter (PM2.5) concentrations in China,” Environmental Science & Technology, 50(21), pp.11452-11459.
[https://doi.org/10.1021/acs.est.6b02562]
-
Salvo, A., 2020, “Local pollution as a determinant of residential electricity demand,” Journal of the Association of Environmental and Resource Economists, 7(5), pp.837-872.
[https://doi.org/10.1086/709533]
-
Staiger, D. and J. H. Stock, 1997, “Instrumental variables regression with weak instruments,” Econometrica, 65(3), pp.557-586.
[https://doi.org/10.2307/2171753]
-
Wei, X., J. Xu, and Y. Kuang, 2023, “How does air pollution affect household energy expenditure: a micro-empirical study based on avoidance behavior,” Journal of Environmental Management, 340, Article 117931.
[https://doi.org/10.1016/j.jenvman.2023.117931]
- Xing, Y. F., Y. H. Xu, M. H. Shi, and Y. X. Lian, 2016, “The impact of PM2.5 on the human respiratory system,” Journal of Thoracic Disease, 8(1), pp.E69-E74.
Website
- Korea Meteorological Administration (KMA), 2026, “Meteorological data,” https://www.kma.go.kr/neng/index.do, , [2026.03.23.]
- Korea Power Statistics Information System(EPSIS), 2026, “Electricity sales,” https://epsis.kpx.or.kr/epsisnew/selectEksaAscAscChart.do?menuId=060401, , [2026.03.23.]
- Korea Environment Corporation(AirKorea), 2026, “Air quality measurement data,” https://www.airkorea.or.kr/web/detailViewDown?pMENU_NO=125, , [2026.03.23.]
권오성: 미국 University of Massachusetts Amherst에서 자원경제학 박사학위를 취득하고 현재 한국농촌경제연구원에서 부연구위원으로 재직 중이다. 주요 관심 분야인 기후변화, 대기오염, 에너지 분야와 관련한 정량적 분석을 계량・통계 등의 다양한 방법론을 사용하여 수행하고 있다(osungkwon@krei.re.kr).