Analysis of Changes in Residential Electricity Consumption across 17 Cities and Provinces in Korea: Using LMDI and Tapio Decoupling Model
Abstract
Residential electricity consumption has emerged as a significant contributor to global greenhouse gas emissions, with its impact intensifying in recent years. Given this significance, this study analyzed changes in residential electricity consumption in 17 cities and provinces in Korea from 2013 to 2021, decomposing them into five drivers using the LMDI method. Additionally, we used the Tapio decoupling model to ascertain the decoupling trend between electricity consumption growth and GRDP. The results showed that the drivers varied across regions, but primarily, the climate effect and energy efficiency effect served as the main contributors to the changes in residential electricity consumption. Furthermore, the worsened decoupling trend observed during COVID-19 persisted subsequently. Based on our findings, we recommended proactively establishing and implementing region-specific policies to curtail residential electricity consumption efficiently.
초록
가정에서의 전력 소비는 국내를 비롯한 전 세계적인 주요 온실가스 배출 요인 중 하나로써, 최근 그 규모가 더욱 커지고 있어 시급한 대응이 필요하였다. 이러한 중요성에 맞춰 이번 연구에서는 2013년부터 2021년까지 국내 17개 광역자치단체별 가정에서의 전력 소비 변화를 LMDI 기법을 활용해 다섯 개의 동인으로 분해 분석하였고, 전력 소비 증감과 GRDP 간의 탈동조화 여부를 Tapio decoupling model을 활용하여 파악하였다. 분석 결과, 지역별 전력 소비 변화에 대한 동인별 영향은 서로 상이하였으나, 전반적으로 기후변화 효과와 에너지 효율 효과가 가정에서의 전력 소비 증감의 주된 요인으로 작용하는 것을 확인할 수 있었다. 또한, 전국적으로 COVID-19 동안 악화된 탈동조화 상태가 이후에도 지속됨을 확인하였다. 본 연구 결과를 바탕으로 기존 국내 가정 부문의 전력 소비 절감 정책에 대한 한계점 및 개선 방안에 대해 제언하였다.
Keywords:
Residential Sector, Electricity Consumption, Subnational Governments, LMDI, Decoupling State키워드:
가정 부문, 전력 소비, 광역자치단체, 로그평균 디비지아 지수 분석, 탈동조화 분석I. Introduction
Residential electricity consumption has emerged as a critical focus in global decarbonization debates, driven by structural shifts that complicate demand management. Despite ongoing efficiency improvements, residential demand continues to rise due to growing ownership and use of electric appliances (Cabeza, Urge-Vorsatz, McNeil, Barreneche, and Serrano, 2014; Sukarno, Matsumoto, and Susanti, 2017), the proliferation of single-person and small households (Park and Yun, 2022), increases in floor area per capita (Goldstein, Gounaridis, and Newell, 2020), and greater cooling needs induced by climate change (United Nations Framework Convention on Climate Change [UNFCCC], 2021). These trends are particularly pronounced in East Asian economies such as South Korea, implying that managing residential electricity demand is a key component of long-term decarbonization strategies, alongside the decarbonization of power generation.
South Korea provides a particularly relevant case. Residential electricity consumption increased from 17,735 GWh in 1990 to 84,427 GWh in 2020, remaining on an upward trajectory even as total domestic electricity consumption began to stabilize around 2019 (Korea Electric Power Corporation [KEPCO], 2025). Although the residential sector accounts for a smaller share (approximately 15%) of total electricity use compared to industry, its volatility significantly affects national peak-load management and grid stability, especially during summer and winter months. Residential energy use also represents a direct interface between energy policy and citizen welfare, shaped by demographic change, housing conditions, and urban development—factors that local governments can influence through planning and building policies. As national and sub-national carbon-neutrality plans are prepared and implemented, understanding the regional dynamics of residential electricity use has become a pressing policy issue.
Existing studies have examined residential electricity consumption from multiple perspectives, including demographic change, urbanization, and climate-related factors. However, most of this literature either focuses on national aggregates or a limited set of regions, and relatively few studies jointly examine climate and demographic drivers of residential electricity use at the regional level in Korea. Previous work has highlighted the role of residential and population growth (Shigetomi et al., 2018) as well as climate variability (Nie, Kemp, Xu, Vasseur, and Fan, 2018), but evidence on how these factors interact to shape regional residential electricity consumption in Korea remains scarce. In particular, there is still limited quantitative understanding of how regional patterns of economic growth, demographic change, and climate variability combine to influence residential electricity demand under a common national policy framework.
This study addresses this gap by applying the Logarithmic Mean Divisia Index (LMDI) method to decompose changes in residential electricity consumption across Korea’s 17 metropolitan and provincial governments. The analysis focuses on five drivers: climate effect, electricity efficiency, floor area density, household size, and population. LMDI is widely used in energy and emission studies because it provides an internally consistent decomposition of changes in aggregate indicators into contributions from multiple factors without leaving a residual term (Ang, 2015). To provide a more comprehensive policy diagnosis, this study integrates LMDI with a Tapio-type decoupling analysis. While the decoupling indicators diagnose the state of the relationship between regional economic growth (GRDP) and electricity consumption (e.g., recoupling vs. decoupling), the LMDI decomposition explains the underlying causes of those outcomes. By combining these two approaches, the analysis identifies not only whether a region is transitioning towards sustainability but also which specific factors are facilitating or hindering that transition.
The analysis covers the period 2013–2021. The starting year is set to 2013 because Sejong City was established in 2012, and 2013 is the first year in which statistics for all 17 metropolitan and provincial governments are reported on a consistent basis. Restricting the sample to this period therefore ensures spatially comparable time series for residential electricity use, GRDP, and other regional indicators. The findings of this study are expected to provide insights for designing region-specific residential electricity demand-management strategies within Korea, while also offering broader lessons for other countries that face similar challenges of demographic change, uneven urban development, and regionally differentiated climate conditions under a national decarbonization policy.
The remainder of the paper is organized as follows. Section 2 reviews previous studies that analyze changes in residential energy use and GHG emissions using decomposition and decoupling approaches. Section 3 describes the data and methods, including the LMDI decomposition framework and the Tapio decoupling indicators. Section 4 presents and discusses the empirical results. Section 5 concludes with key policy implications, limitations, and directions for future research.
Ⅱ. Literature Review
In studies of residual energy use, decomposition and decoupling analyses have been widely used to quantify how different factors drive changes in residential energy use and associated environmental impacts over time (Liu et al., 2016; Zheng et al., 2019). By structuring energy use as an identity and decomposing it into economic, environmental, demographic, or socioeconomic factors, decomposition approaches provide a systematic way to evaluate how different drivers shape trends in energy consumption and greenhouse gas (GHG) emissions (Hoekstra and Van den Bergh, 2003). Among various techniques, the LMDI method has become one of the most commonly adopted tools because it is flexible, easy to implement, and yields interpretable results, while satisfying desirable properties such as complete decomposition without residual terms (Ang, 2015; Mousavi, Lopez, Biona, Chiu, and Blesl, 2017; Xu and Ang, 2013).
A growing number of studies apply LMDI to analyze residential energy or electricity consumption. For example, Huang (2020) identified appliance saturation and lifestyle changes as key drivers of demand growth in Taiwan. Similarly, studies in China and other regions—such as Hunan Province, Beijing, and Morocco—have emphasized the roles of income growth, urbanization, and energy intensity in shaping residential or household electricity consumption (Chen, Lin, Wang, Mao, and Peng, 2022; Haouraji, Oubnaki, Mounir, and Mounir, 2023; Meng, Wu, Zhou, and Wang, 2019). Beyond these economic and structural factors, demographic and housing characteristics are increasingly recognized as primary determinants (Zang, Zhao, Wang, and Guo, 2017). Notably, Shigetomi et al. (2018) utilized LMDI to analyze Japan’s 47 prefectures, revealing substantial regional heterogeneity and demonstrating that an increasing number of dwellings drove CO₂ emissions even amidst population decline.
At the same time, growing concern about climate change has necessitated a focus on how climatic conditions interact with residential energy use (Rogan, Cahill, and Ó Gallachóir, 2012). As global warming intensifies cooling requirements, many countries have observed significant increases in electricity consumption, particularly in warmer seasons (Auffhammer and Mansur, 2014; Li, Pizer, and Wu, 2019). For instance, Nie et al. (2018) found that both climatic factors and income growth contributed to rising residential electricity use in urban and rural China, while Wang, Sun, Zhao, and Wang (2021) reported distinct urban–rural patterns in climate-sensitive building energy use using a Kaya–LMDI framework.
Whereas decomposition analysis attributes changes in energy use to specific drivers, decoupling analysis examines the overall relationship between economic growth and environmental pressure. The central question in decoupling studies is whether economies can grow without proportionally increasing their ecological footprint, including energy use and emissions. Early empirical work by Zhang (2000) applied decoupling indicators to energy and emissions, and subsequent studies refined the typology of decoupling states. Juknys (2003) proposed a conceptual classification of decoupling types, and Tapio (2005) further developed an elasticity-based framework that distinguishes eight decoupling states depending on the sign and magnitude of changes in economic output and environmental indicators. These indices have been widely used to diagnose the state of the relationship between economic growth and energy consumption or emissions in different sectors, including buildings and households, often revealing patterns of weak decoupling driven by efficiency gains but offset by activity growth (Ma, Ye, Shi, and Zou, 2016; Zhang and Bai, 2018).
In South Korea, empirical research on residential electricity demand has examined a wide range of determinants, from household characteristics to environmental conditions. Earlier studies primarily relied on household-level microdata and regression models to identify key drivers of electricity use. For example, No (2014) analyzed how household composition, appliance ownership, and dwelling characteristics influence residential electricity demand, showing that income and certain appliance types (e.g., cooling systems) are statistically significant factors. Han and Jung (2020) explored the role of environmental variables in shaping residential energy consumption, emphasizing the need for policies that reflect diverse household attributes and regional environmental conditions. More recently, Park and Yun (2022) investigated demographic change and regional convergence in per-capita household electricity consumption across Korean regions, finding evidence of convergence alongside substantial regional heterogeneity in adjustment speeds.
These studies collectively demonstrate that demographic structure, housing conditions, income, and climate are central to understanding household energy use in Korea. However, a methodological gap remains. Most existing Korean studies rely on regression-based approaches or micro-level surveys, which identify statistically significant determinants but do not quantify the year-to-year contribution of each driver to total changes in electricity consumption. Relatively few studies have applied LMDI decomposition to Korean residential electricity consumption in a way that simultaneously considers climate and demographic factors at the regional level, and even fewer have combined this with decoupling analysis. Against this backdrop, this study differentiates itself by adopting a decomposition framework that complements previous regression-based work. Whereas regression analysis identifies determinants, decomposition methods quantify drivers of change, and decoupling indicators summarize the sustainability of these trends. Integrating these approaches provides a more comprehensive diagnosis of regional residential electricity demand under Korea’s national policy framework.
Ⅲ. Data and Methodology
1. Study area and data source
This study examines 17 metropolitan and provincial governments in Korea over the period 2013–2021. The starting year is set to 2013 because Sejong City was established in 2012, and 2013 is the first year in which statistics for all 17 regions are reported on a consistent basis. Focusing on 2013–2021 therefore ensures spatially comparable time series for residential electricity use, demographic variables, and economic indicators across all regions.
Residential electricity consumption data were obtained from the Korea Electric Power Corporation (KEPCO, 2022). Population and household statistics were sourced from the Resident Registration Population database (Ministry of the Interior and Safety [MOIS], 2022), and the gross floor area of residential buildings was taken from the national Residential Building Gross Floor Area database (Ministry of Land, Infrastructure and Transport [MOLIT], 2022). Regional temperature data were collected from the Korea Meteorological Administration (KMA, 2022).
While many studies rely on a single national balance-point temperature (e.g., 18.3 °C) to calculate heating and cooling degree days, this study adopts region-specific balance-point temperatures derived from Lee, Baek, and Cho (2014). This approach allows for a more granular assessment of climatic variability across Korea’s diverse geography. Degree-day metrics act as a proxy for complex climate–behavior interactions; however, utilizing region-specific baselines is expected to improve the sensitivity of the climate indicator compared with a uniform national standard.
Gross regional domestic product (GRDP) data were obtained from Statistics Korea (KOSTAT, 2022). To convert nominal monetary values into real terms, the national GDP deflator from the International Monetary Fund (IMF, 2022) was applied. The national deflator was selected to maintain temporal consistency and mitigate potential discrepancies arising from varying regional accounting practices. While this approach ensures consistency in trend analysis, it also implies that regional price heterogeneity is not explicitly captured—a limitation that is taken into account when interpreting the decoupling results. Detailed variable definitions and data coverage are summarized in <Table 1>.

Utilized datasets in this study
2. The LMDI method
The LMDI analysis of residential electricity consumption in year t can be conducted by the following Eq. (1):
| (1) |
Where, the superscript t stands for the year and subscript i refers to 17 cities and provinces in Korea. is the aggregate residential electricity consumption in region i at year t. is the residential electricity consumption in region i at year t, adjusted for climate change impacts using HCDD as shown in the <Table 2>. Ei is the residential electricity consumption in region i at year t without considering the effects of climate change. is the gross floor area of the residential building in region i at year t. is the total household in region i at year t and is the total population in region i at year t. refers to the climate-adjusted coefficient in region i at year t, representing the climate effect. denotes the residential electricity consumption per gross floor area in region i at year t, representing the energy efficiency effect. denotes the gross area per household in region i at year t, representing the floor density effect. indicates the number of households per capita in region i at year t, representing the household composition effect.
Heating and cooling degree days by region in Korea, 2013-2021
According to Ang (2015), the change in residential electricity consumption between a base year (0) and year t (∆RECi) can be expressed as follows:
| (2) |
| (3) |
| (4) |
| (5) |
| (6) |
3. The Tapio decoupling model
The Tapio decoupling model is typically used for describing the decoupling state and correlations among socio-economic driving forces (Duan, Feng, Zhou, Chang, and Li, 2021). Tapio (2005) categorized the decoupling states into eight based on the comparison between the growth rate of GDP and GHG emissions. However, in this study, we altered the structure of the equation to delve into the relationship between GRDP and electricity consumption, as shown in <Figure 1>. The best decoupling state is the strong decoupling state, meaning that the electricity consumption decreases while the GRDP increases. In contrast, the worst decoupling state is the strong negative state, where electricity consumption increases while the GRDP decreases.

Description of economic growth and electricity consumption decoupling state
In this study, the Tapio decoupling model is calculated as follows:
| (7) |
where ϵ is the decoupling elasticity, defined as the ratio of the growth rate of residential electricity consumption to the growth rate of GRDP.
Ⅳ. Results
<Figure 2> depicts the decomposition of changes in residential electricity consumption across 17 cities and provinces in Korea between 2013 and 2021, highlighting the contributions of the five primary drivers. Most regions experienced an overall increase in residential electricity consumption over the study period, but the relative importance and direction of each driver varied substantially by region.

Waterfall chart of decomposition results of changes in residential electricity consumption, 2013-2021
Over the study period, the climate effect generally acted to reduce residential electricity consumption. This effect reflects how changes in space cooling and heating demand influence electricity use. The results indicate a decline in heating and cooling degree days in most regions, which translated into a negative contribution of the climate effect to total residential electricity consumption.
By contrast, the energy efficiency effect contributed to an increase in residential electricity consumption in many regions. This effect captures changes in electricity use per unit of residential floor area; a positive contribution therefore implies a deterioration of electricity efficiency, whereas a negative contribution indicates an improvement. The decomposition shows that efficiency patterns differ across regions. For example, in Ulsan the energy efficiency effect is −6.23%, indicating a notable improvement in electricity efficiency that partially offsets demand increases from floor density (+7.59%) and smaller household size (+13.24%). In Incheon, however, the energy efficiency effect is +8.22%, suggesting a deterioration in electricity efficiency despite a mitigating climate effect of −9.33%.
The floor density effect relates to the amount of residential floor area per household. In most regions, this factor contributed positively to residential electricity consumption, suggesting that average living space expanded over the study period. Gyeongbuk and Daejeon were notable exceptions, where the floor density effect slightly reduced electricity consumption, implying a relative contraction or slower growth of floor area per household.
The household size and population effects reflect demographic dynamics. The household size effect measures the impact of changes in the number of persons per household, whereas the population effect captures changes in the total regional population. In most regions, the population effect contributed to a reduction in residential electricity consumption, while the household size effect contributed to an increase. This combination implies that, despite slower or declining population growth, the rising share of single-person and small households tended to increase residential electricity consumption.
Sejong provides a contrasting case. Established to alleviate population concentration in the Seoul metropolitan area, Sejong experienced rapid population growth during the study period. As a result, the population effect in Sejong reaches +197.36%, far exceeding the contributions of other drivers and explaining the sharp increase in residential electricity consumption despite a negative climate effect of −17.46% and only moderate contributions from floor density (+7.69%) and household size (+11.68%).
<Figure 3> illustrates the annual changes in residential electricity consumption in each region, decomposed into the main driving forces. In most regions, total residential electricity consumption decreased between 2013–2015 and 2018–2019, whereas it increased between 2015–2018 and 2019–2021. These alternating phases of decline and growth indicate that changes in residential electricity demand are not monotonic but occur in waves, reflecting the combined influence of climate variability, efficiency dynamics, and gradual demographic change.

Change in residential electricity consumption by driving forces in 17 cities and provinces in Korea, 2013-2021
The stacked bars show that short-term fluctuations are mainly governed by the climate and electricity efficiency effects. Years with strong negative contributions from the climate effect generally correspond to reductions in total residential electricity consumption, while years with adverse efficiency effects tend to coincide with rebounds in demand. In contrast, the floor density, household size, and population effects evolve more smoothly over time. These structural and demographic drivers provide a slowly changing background trend, on top of which the more volatile climate and efficiency effects generate year-to-year variation.
The temporal patterns also differ across regions. Large metropolitan areas such as Seoul, Busan, Daegu, Incheon, and Gyeonggi typically exhibit larger swings in total change, suggesting that dense urban regions are more sensitive to shifts in climate conditions and efficiency. Several provincial regions, including Gangwon, Chungbuk, and Jeonnam, display more moderate changes, with the climate effect often offset by improvements in electricity efficiency or by relatively stable demographic factors. In some regions, such as Jeju and Gyeongnam, episodes of declining consumption are concentrated in specific sub-periods, followed by a recovery driven mainly by climate or efficiency effects.
Sejong provides a contrasting case. The total change in Sejong is positive in nearly all sub-periods, and the stacked bars reveal that this persistent increase is dominated by the population effect. While climate and efficiency still contribute to the year-to-year variation, rapid population growth in Sejong consistently pushes residential electricity consumption upward, distinguishing it from most other regions where population effects are small or even negative. This highlights how, in regions experiencing active in-migration and new housing development, demographic expansion can outweigh the mitigating influence of favorable climate conditions or efficiency gains.
During the periods 2019–2020 and 2020–2021, total residential electricity consumption increased in most regions, but the underlying drivers differed. For 2019-2020, the main driver for the increase in residential electricity consumption was the electricity efficiency effect. This surge was significantly influenced by the COVID-19 pandemic, prompting people to stay home more and use their appliances more due to lockdowns. Conversely, a major factor in the increase in residential electricity consumption in 2020-2021 was the climate effect, where global warming due to the greenhouse effect increased demand for residential cooling, as also found in <Table 2>.
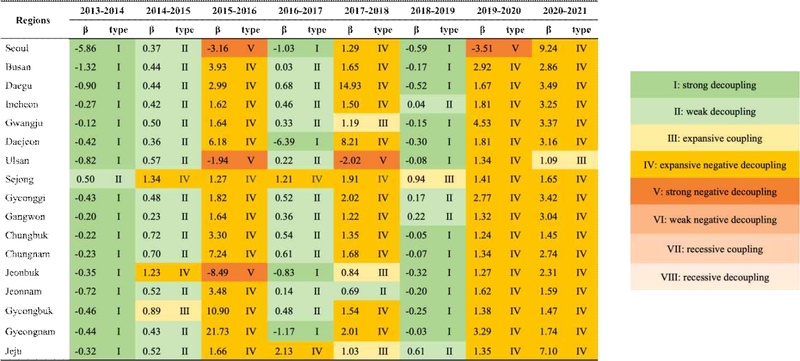
<Table 3> summarizes the decoupling states between residential electricity consumption and GRDP for all regions in Korea. During the periods 2013–2015, 2016–2017, and 2018–2019, most regions fall into strong decoupling (Type I) or weak decoupling (Type II), indicating that residential electricity consumption grew more slowly than regional economic output or even declined while GRDP continued to rise. By contrast, in 2015–2016, 2017–2018, and 2019–2021, many regions shift toward expansive negative decoupling (Type IV) or strong negative decoupling (Type V), where residential electricity use increases despite stagnating or declining economic activity. This pattern suggests that the relationship between economic growth and residential electricity demand is highly time-dependent, alternating between periods of mitigation and periods in which electricity demand becomes more detached from economic performance.
The decoupling state between residential electricity consumption and GRDP by region, 2013-2021
The change in decoupling patterns after 2019 highlights the profound impact of the COVID-19 pandemic on the linkage between economic growth and residential electricity consumption in Korea. From 2019 onward, most regions, including Seoul, exhibit negative decoupling states, meaning that residential electricity consumption continued to rise even as regional economies grew only modestly or contracted. Seoul is particularly notable: during the pandemic years, residential electricity demand increased sharply while GRDP weakened. This pattern is consistent with stay-at home measures, increased time spent indoors, and changes in household energy use that were not accompanied by parallel growth in economic output. This divergence underscores how external shocks such as COVID-19 can temporarily weaken or reverse the usual coupling between economic activity and residential electricity demand.
Ⅴ. Conclusion
This study investigates the main driving forces behind changes in residential electricity consumption across 17 cities and provinces in Korea using an LMDI decomposition and Tapio decoupling analysis. The results show that residential electricity consumption has increased in most regions over the past decade, but the underlying drivers differ substantially across space and time. Climate-related factors and changes in electricity efficiency exert the largest short-term influence, while demographic and housing-related factors shape longer-term trends. The household-size effect generally increases electricity use, whereas the population effect tends to reduce it in many regions, with Sejong as a notable exception where rapid in-migration dominates. The decoupling analysis further indicates that the relationship between residential electricity demand and economic growth has weakened since the COVID-19 pandemic, with many regions shifting toward negative decoupling.
Based on these findings, several policy implications emerge.
First, residential electricity policies should be reconsidered from a regional perspective. The decomposition results indicate that the relative importance of climate, efficiency, floor density, household size, and population varies across regions. Uniform policies may therefore be less effective than strategies tailored to regional conditions, including climate, urban form, and demographic structure. In particular, the climate effect has become a major contributor to recent increases in residential electricity consumption and is likely to intensify under continued warming. Climate adaptation and mitigation policies—such as stricter building-envelope standards, promotion of high-efficiency cooling systems, and region-specific demand-response programs during heat waves—should be integrated into residential energy policy.
Second, demographic change, especially the rise in single-person and small households, plays a non-negligible role in driving up residential electricity consumption even when aggregate population growth slows. Policies that enhance energy efficiency in smaller households can help counteract this trend. Examples include targeted support for replacing inefficient appliances, incentives for compact and energy-efficient housing design, and subsidies or financing schemes for installing rooftop PV or other distributed resources suitable for small households. Such measures can reduce per-household electricity demand while accommodating ongoing demographic shifts.
Third, the deterioration in decoupling status observed since the onset of the COVID-19 pandemic suggests that residential electricity demand has become less closely tied to economic performance. In many regions, electricity use increased despite stagnant or declining GRDP, reflecting behavioural and structural changes such as increased time spent at home and more intensive appliance use. This pattern continues into the post-pandemic period, implying that some of these changes may persist. Promoting low-carbon, energy-efficient lifestyles in the residential sector—through information campaigns, dynamic pricing, building retrofits, and digital tools for monitoring and managing home energy use—can help to realign residential electricity demand with long-term decarbonization objectives. Strengthening the resilience of residential energy demand to social and environmental shocks will be crucial for achieving sustainable and equitable energy transitions in Korea.
Overall, the analysis demonstrates that residential electricity consumption in Korea is shaped by a complex interplay of climate, efficiency, housing, and demographic factors, and that these drivers operate differently across regions and over time. By combining decomposition and decoupling approaches, this study provides an integrated picture of how and why residential electricity demand has evolved, and where policy efforts should be concentrated. Taken together, these insights can help national and local policymakers design more nuanced, region-specific strategies that curb residential electricity demand, protect household welfare, and advance economy-wide decarbonization. Finally, the evidence from Korea’s 17 cities and provinces may also offer a useful reference for policymakers in other countries with comparable climatic conditions and subnational administrative structures, supporting the design of localized energy policies.
References
-
Ang, B. W., 2015, “LMDI decomposition approach: A guide for implementation,” Energy Policy, 86, pp.233-238.
[https://doi.org/10.1016/j.enpol.2015.07.007]

-
Auffhammer, M. and E. T. Mansur, 2014, “Measuring climatic impacts on energy consumption: A review of the empirical literature,” Energy Economics, 46, pp.522-530.
[https://doi.org/10.1016/j.eneco.2014.04.017]
-
Cabeza, L. F., D. Urge-Vorsatz, M. A. McNeil, C. Barreneche, and S. Serrano, 2014, “Investigating greenhouse challenge from growing trends of electricity consumption through home appliances in buildings,” Renewable and Sustainable Energy Reviews, 36, pp.188-193.
[https://doi.org/10.1016/j.rser.2014.04.053]
-
Chen, J., Y. Lin, X. Wang, B. Mao, and L. Peng, 2022, “Direct and indirect carbon emission from household consumption based on LMDI and SDA model: A decomposition and comparison analysis,” Energies, 15(14), p.5002.
[https://doi.org/10.3390/en15145002]
-
Duan, T., J. Feng, Y. Zhou, X. Chang and Y. Li, 2021, “Systematic evaluation of management measure effects on the water environment based on the DPSIR-Tapio decoupling model: A case study in the Chaohu Lake watershed, China,” Science of the Total Environment, 801, p.149528.
[https://doi.org/10.1016/j.scitotenv.2021.149528]
-
Goldstein, B., D. Gounaridis, and J. P. Newell, 2020, “The carbon footprint of household energy use in the United States,” Proceedings of the National Academy of Sciences, 117(32), pp.19122-19130.
[https://doi.org/10.1073/pnas.1922205117]
-
Haouraji, C., H. Oubnaki, I. Mounir, and B. Mounir, 2023, “Analyzing Morocco’s electricity consumption changes with an LMDI decomposition model: A global and sectoral perspective,” E3S Web of Conferences, 469, p.00029.
[https://doi.org/10.1051/e3sconf/202346900029]
-
Han, J. and Y. Jung, 2020, “Analysis on the characteristics of Seoul electricity consumption using LMDI,” Journal of Environmental Policy and Administration, 28(2), pp.131-151.
[https://doi.org/10.15301/jepa.2020.28.2.131]
-
Hoekstra, R. and J. C. van den Bergh, 2003, “Comparing structural decomposition analysis and index,” Energy Economics, 25(1), pp.39-64.
[https://doi.org/10.1016/S0140-9883(02)00059-2]
-
Huang, Y.-H., 2020, “Examining impact factors of residential electricity consumption in Taiwan using index decomposition analysis based on end-use level data,” Energy, 213, p.119067.
[https://doi.org/10.1016/j.energy.2020.119067]
- International Monetary Fund [IMF], 2022, International Financial Statistics: GDP deflators, IMF.
- Juknys, R., 2003, “Transition period in Lithuania – do we move to sustainability,” Energy, 26(4), pp.4-9.
- Korea Electric Power Corporation [KEPCO], 2022, Electric Power Statistics Information System, KEPCO.
- Korea Electric Power Corporation [KEPCO], 2025, Annual electricity statistics, KEPCO.
- Korea Meteorological Administration [KMA], 2022, Meteorological statistics annual report, KMA.
-
Lee, K., H.-J. Baek, and C. Cho, 2014, “The estimation of base temperature for heating and cooling degree-days for South Korea,” Journal of Applied Meteorology and Climatology, 53(2), pp.300-309.
[https://doi.org/10.1175/JAMC-D-13-0220.1]
-
Li, Y., W. A. Pizer, and L. Wu, 2019, “Climate change and residential electricity consumption in the Yangtze River Delta, China,” Proceedings of the National Academy of Sciences, 116(2), pp.472-477.
[https://doi.org/10.1073/pnas.1804667115]
-
Liu, Z., S. J. Davis, K. Feng, K. Hubacek, S. Liang, and L. D. Anadón et al., 2016, “Targeted opportunities to address the climate–trade dilemma in China,” Nature Climate Change, 6(2), pp.201-206.
[https://doi.org/10.1038/nclimate2800]
-
Ma, X.-W., Y. Ye, X.-Q. Shi, and L.-L. Zou, 2016, “Decoupling economic growth from CO₂ emissions: A decomposition analysis of China’s household energy consumption,” Advances in Climate Change Research, 7(3), pp.192-200.
[https://doi.org/10.1016/j.accre.2016.09.004]
-
Meng, M., S. Wu, J. Zhou, and X. Wang, 2019, “What is currently driving the growth of China’s household electricity consumption? A clustering and decomposition analysis,” Sustainability, 11(17), p.4648.
[https://doi.org/10.3390/su11174648]
- Ministry of the Interior and Safety [MOIS], 2022, Resident registration population statistics, MOIS.
- Ministry of Land, Infrastructure and Transport [MOLIT], 2022, Residential building gross floor area statistics, MOLIT.
-
Mousavi, B., N. S. A. Lopez, J. B. M. Biona, A. S. F. Chiu, and M. Blesl, 2017, “Driving forces of Iran’s CO₂ emissions from energy consumption: An LMDI decomposition approach,” Applied Energy, 206, pp.804-814.
[https://doi.org/10.1016/j.apenergy.2017.08.199]
-
Nie, H. G., R. Kemp, J. H. Xu, V. Vasseur, and Y. Fan, 2018, “Drivers of urban and rural residential energy consumption in China from the perspectives of climate and economic effects,” Journal of Cleaner Production, 172, pp.2954-2963.
[https://doi.org/10.1016/j.jclepro.2017.11.117]
- No, J. Y. A., 2014, “Effects of demographics and usage of appliances on household electricity demand in Korea,” Journal of Korean Economics Studies, 32(2), pp.177-202.
-
Park, J. and S.-J. Yun, 2022, “Social determinants of residential electricity consumption in Korea: Findings from a spatial panel model,” Energy, 239, p.122272.
[https://doi.org/10.1016/j.energy.2021.122272]
-
Rogan, F., C. J. Cahill, and B. P. Ó Gallachóir, 2012, “Decomposition analysis of gas consumption in the residential sector in Ireland,” Energy Policy, 42, pp.19-36.
[https://doi.org/10.1016/j.enpol.2011.10.059]
-
Shigetomi, Y., K. Matsumoto, Y. Ogawa, H. Shiraki, Y. Yamamoto, Y. Ochi, and T. Ehara, 2018, “Driving forces underlying sub-national carbon dioxide emissions within the household sector and implications for the Paris Agreement targets in Japan,” Applied Energy, 228, pp.2321-2332.
[https://doi.org/10.1016/j.apenergy.2018.07.057]
- Statistics Korea, 2022. “Regional GDP, Gross regional income and Individual income,” Korean Statistical Information Service (KOSIS).
-
Sukarno, I., H. Matsumoto, and L. Susanti, 2017, “Household lifestyle effect on residential electrical energy consumption in Indonesia: On-site measurement methods,” Urban Climate, 20, pp.20-32.
[https://doi.org/10.1016/j.uclim.2017.02.008]
-
Tapio, P., 2005, “Towards a theory of decoupling: Degrees of decoupling in the EU and the case of road traffic in Finland between 1970 and 2001,” Transport Policy, 12(2), pp.137-151.
[https://doi.org/10.1016/j.tranpol.2005.01.001]
- United Nations Framework Convention on Climate Change [UNFCCC], 2021, Nationally Determined Contributions under the Paris Agreement: Synthesis report by the secretariat, United Nations Framework Convention on Climate Change.
-
Wang, S., S. Sun, E. Zhao, and S. Wang, 2021, “Urban and rural differences with regional assessment of household energy consumption in China,” Energy, 232, p.121091.
[https://doi.org/10.1016/j.energy.2021.121091]
-
Xu, X. and B. W. Ang, 2013, “Index decomposition analysis applied to CO₂ emission studies,” Ecological Economics, 93, pp.313-329.
[https://doi.org/10.1016/j.ecolecon.2013.06.007]
-
Zang, X., T. Zhao, J. Wang, and F. Guo, 2017, “The effects of urbanization and household-related factors on residential direct CO₂ emissions in Shanxi, China from 1995 to 2014: A decomposition analysis,” Atmospheric Pollution Research, 8(2), pp.297-309.
[https://doi.org/10.1016/j.apr.2016.10.001]
-
Zhang, M. and C. Bai, 2018, “Exploring the influencing factors and decoupling state of residential energy consumption in Shandong,” Journal of Cleaner Production, 194, pp.253-262.
[https://doi.org/10.1016/j.jclepro.2018.05.122]
-
Zhang, Z., 2000, “Decoupling China’s carbon emissions increase from economic growth: An economic analysis and policy implications,” World Development, 28(4), pp.739-752.
[https://doi.org/10.1016/S0305-750X(99)00154-0]
-
Zheng, J., Z. Mi, D. M. Coffman, S. Milcheva, Y. Shan, D. Guan, S. Wang et al., 2019, “Regional development and carbon emissions in China,” Energy Economics, 81, pp.25-36.
[https://doi.org/10.1016/j.eneco.2019.03.003]
Mingyu Kim: Mingyu Kim is a Ph.D. candidate in the Graduate School of Green Growth and Sustainability at the Korea Advanced Institute of Science and Technology (KAIST), South Korea. His research examines changes in direct household electricity consumption driven by indoor activities and indirect household electricity consumption associated with households’ economic behavior. He also investigates how deep-learning methods can be integrated with economic accounts to predict supply-chain structural changes under unforeseen shocks while enforcing fundamental accounting identities(kmingyu12@kaist.ac.kr).