A Meta-Analysis of the Intellectual Structure of Climate Change Research Published in Environmental Policy
Abstract
This study examines the intellectual structure of climate change research in Korean academia, focusing on 131 climate change-related articles published in Environmental Policy for 30 years between 1995 and 2024. This study uses the analysis and visualization of word clouds and clustered network structures of keywords and authors. It explores main topics, temporal changes, and collaboration patterns. Additionally, it examines differences among various approaches to addressing climate change. The analysis identifies prominent topics such as Climate Change, Carbon, Emission, and Greenhouse Gas, while noting that Global Warming, Climate Crisis, Carbon Neutrality, and Net Zero have gained limited attention so far. It also reveals temporal shifts in research focus, with increasing diversification of topics. Collaboration patterns highlight the significant role of professors and institutional researchers, as well as active co-authorship with emerging scholars, including doctoral and master’s students. These findings provide a broad overview of how research topics and academic collaboration have evolved, offering insights into the intellectual landscape of climate change-related academia in Korea. By understanding these dynamics, this study lays the groundwork for future comparative analyses and deeper explorations into the field.
Keywords:
Environmental Policy, Climate Change, Keyword, Network, ClusteringI. Introduction
Climate change is recognized as the greatest environmental and economic issue of the 21st century and ultimately a matter of survival. It urgently needs to be addressed, as it affects not only the current generation but also future ones. This situation is reflected in the academic field. Its economic, social, and cultural impacts, as well as the scientific facts and evidence related to climate change, are increasingly studied.
Korean academia has also not overlooked climate change research. Founded in 1995, the Korea Environmental Policy and Administration Society has led this academic field for 30 years. Its journal, Environmental Policy, has served as a primary platform for introducing and disseminating valuable climate change research. However, no studies have attempted to understand how climate change research has been formed and developed through Environmental Policy.
This study aims to present the intellectual structure of climate change research in Korea reflected in climate change-related articles published in Environmental Policy: an intellectual structure refers to the framework that organizes and shapes the themes and concepts of a specific field, along with the systems involved in their formation and development. For this purpose, this study performed a network analysis of keywords and authors within the framework of graph theory (Freeman, 1979; Wasserman and Faust, 1994; Watts, 2004), focusing on the co-occurrence of keywords and the co-authorship of authors.
This study assumes that co-occurring keywords share closer and stronger thematic relationships, while co-authored authors exhibit tighter collaborative ties, compared to those that do not co-author. This assumption aligns with studies like He (1999), Hellsten & Leydesdorff (2015), Kim & Yun (2015), and Faraji et al. (2022), which explored intellectual structures using graph theory. In this study, based on this assumption, networks connecting co-occurring keywords and networks connecting co-authors are constructed and analyzed.
Through the analysis of keyword and author networks, this study attempts to find answers to the following questions:
- RQ1: What are the main topics that make up the climate change research published in Environmental Policy?
- RQ2: What are the changes in the field of climate change research in Korea over the past 30 years as observed from the climate change research published in Environmental Policy?
- RQ3: Do the key concepts and issues addressed in climate change research published in Environmental Policy vary across the different disciplinary perspectives?
- RQ4: What is the composition of authors and the state of collaboration for the climate change research published in Environmental Policy?
This paper is organized as follow: Section 2 introduces the methods used in this study. Section 3 presents the results and findings of the analysis. Section 4 discusses some implications and limitations, and Section 5 provides the conclusions.
Ⅱ. Methods
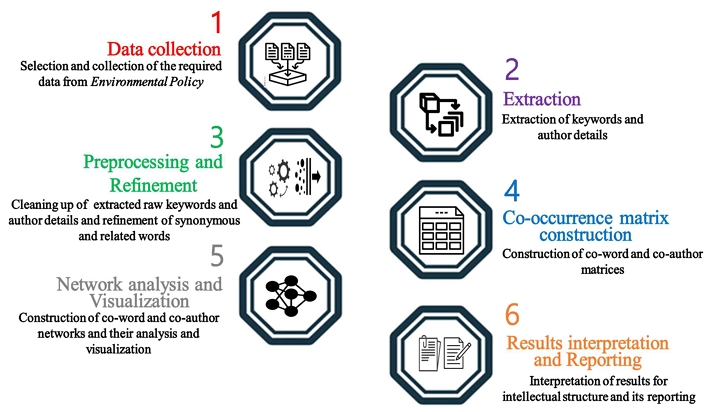
The workflow of this study is illustrated in <Figure 1>.1) The first task of this study was to select and collect climate change-related articles published in Environmental Policy. From Volume 1, Issue 1 in December 1993 to the special issue in June 2024, a total of 776 articles have been published in Environmental Policy.2)
To collect the articles related to climate change, we selected those that included the terms Climate Change, Global Warming, Climate Crisis, Greenhouse Gas, Carbon, Carbon Neutrality, or Net Zero and their corresponding Korean terms (including variations with and without spaces between words) in their titles or keywords. As a result, a total of 131 articles (16.9% of the total number of articles) were found to include these terms in their titles or keywords. 122 articles were written in Korean and 9 articles in English. In this study, these 131 articles were considered as climate change-related articles and were chosen as the subjects for analysis.
The next step was to extract the keywords, author information, and publication year of the articles selected for analysis.3) From the articles downloaded from the journal website (https://kepas.or.kr/homepage/custom/papersearch), the information was extracted and recorded in Excel.
This step was followed by a preprocessing phase. In this phase, stop words were removed and author identity verification was conducted. Next, different forms of the same word were treated as a single lexeme and the occupation and status of the authors at the time of writing the article were categorized into six groups: professor, institutional researcher, PhD, PhD student, Master and Master’s student and others.
The refinement process depends on the decision to analyze both multi-word and single-word keywords submitted by the authors or to decompose the multi-word keywords into single words for analysis. Both approaches have their own advantages and disadvantages (Romo-Fernández, Guerrero-Bote, & Moya-Anegón, 2013; Seong, Hwang, Stanescu, Lee, & Lee, 2022).
Using multi-word keywords in their original form helps to understand the unique concept conveyed by the keywords. In network analysis, however, their use weakens the frequency and significance of words commonly shared across multiple multi-word keywords. It also diminishes the strength of its relation to other keywords and ignores other constituent words.
Practical concern is also an obstacle to choosing the multi-word approach. It is related to the partial overlap among the multi-word keywords. For instance, if three articles include Carbon Emissions Reduction, Emissions Reduction, and Emissions Reduction Policy as keywords, respectively, it is not an easy work to decide whether to treat all of them as separate multi-word keywords or to treat only Emissions Reduction as a multi-word keyword. Furthermore, it is also extremely challenging to establish principled and consistent criteria to handle other similar cases.
On the other hand, the use of single words extracted from a multi-word keyword highlights the core concept commonly shared across multiple multi-word keywords containing the word (Seong et al., 2022). The frequencies of the remaining constituent words can also contribute to the overall frequency. However, the single-word approach fails to capture the advantage of multi-word keywords in reflecting their unique, exclusive concepts in network analysis.
For instance, in the data of this study, Gas appears a total of 35 times, with 34 of those instances occurring as part of Greenhouse Gas and only one instance used independently. Moreover, Greenhouse is never observed outside the context of Greenhouse Gas, and when used independently, it loses its contextual meaning. Therefore, in such a case, it is more helpful to treat the multi-word keyword Greenhouse Gas as a single unit.
In contrast, Carbon exhibits a different pattern. Carbon appears a total of 58 times. It seems to be similar to Greenhouse and Gas in that it was not presented as an independent keyword by the authors. However, it differs significantly because the terms accompanying Carbon in multi-word keywords, like Dioxide, Neutrality, Reduction, Tax, and Emission, are highly diverse. There are 46 distinct multi-word keywords that include Carbon, even though partial overlap in the keywords is observed. If multi-word keywords containing Carbon are treated as single units, it would not only diminish the significance of Carbon’s frequency but also obscure its role as a pivot connecting different concepts. Additionally, it would result in disregarding the frequencies of the other constituent words. Therefore, it is advisable to decompose such multi-word keywords into their individual constituent words.
This study adopted a single-word-focused analysis, except for the six terms: Climate Change, Global Warming, Climate Crisis, Greenhouse Gas, Carbon Neutrality, and Net Zero, which were used as key focus terms during the article selection process. The reason is that the authors of this study consider these terms to embody core concepts related to climate change, making it worthwhile to examine their roles within the network structure.
For refining keywords, the process involved preparing multi-word terms to make them readable by the R program (R Core Team, 2024). This included separating the words within each multi-word term into individual units while maintaining recognition of six specific multi-word terms as single units.
Another refinement process was to standardize synonymous words and semantically or morphologically related words into a single unified word. For example, in the analyzed articles, both Emissions Trading System and Emissions Trading Scheme were observed. During the refinement process, the synonymous words System and Scheme were standardized to System for consistency. Acronyms, such as ETS and CO2, were also targets for refinement. For example, in the case of ETS and CO2, these acronyms were spelled out as Emissions Trading System and Carbon Dioxide, respectively, and then decomposed as individual words.
The next step in the refinement process was to assign IDs to authors to ensure their anonymity while allowing their profession or status to be identified. For example, professors were assigned a number preceded by P, such as P01 and P02, institutional researchers were assigned a number preceded by R, and authors who wrote multiple articles and transitioned from being institutional researchers to professors were assigned a number preceded by RP.
The final step in the refinement process was to categorize the selected articles according to different time periods and classifying them based on their content. The criteria for these time periods and content-based classifications will be presented in the following section.
The refined data served as the input for making co-occurrence matrices and both co-word networks and co-author networks were constructed from various perspectives, using the co-occurrence matrices as input. Based on the results of these processes, analyses and interpretations of the intellectual structures were conducted.
In this study, the works for analysis and visualization relied on the use of R program. The clusters were formed using the Louvain algorithm (Blondel, Guillaume, Lambiotte, & Lefebvre, 2008). More details about the clustered network will be presented in Section 3. One of the co-authors of this study performed the initial R coding aligned with the purpose of the research, and based on the initial code, the final code was completed through interactive discussions with ChatGPT (October 2024 version) (OpenAI, 2024). The .csv format file served as the input for R, and the output from R was also saved in .csv format files. In this article, due to spatial constraints, not all the frequencies, degree centralities, and betweenness centralities measured in this study are presented, and most figures are included in a reduced size. All these measured values, the R-code used to derive them, and the figures in their expanded size are available in the OSF repository (https://osf.io/vm38r/).
III. Results and Findings
1. Data overview
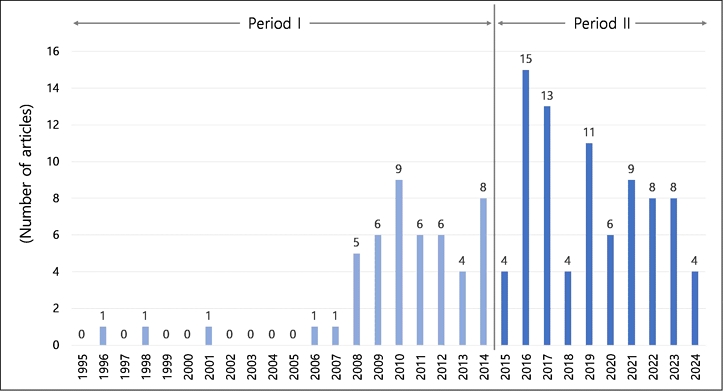
The publication trend of climate change-related articles in Environmental Policy shows that only a few related articles appeared initially, but publications began to increase from 2008, reaching a peak in 2016 and 2017, as shown in <Figure 2>.
To analyze changes in trends over time, this study divided the timeline into three periods, the entire timeframe (1995-2024), the first 20 years (1995-2014), and the latter 10 years (2015-2024) for the following reasons. The first reason for this division is that only a very small number of articles were published in the first 10 years, and over 60% of all articles appeared in the last 10 years, with peaks in 2015 and 2016. The second reason is the consideration of major climate change events, specifically the release of the AR5 Synthesis Report (IPCC, 2014) in November 2014 and the adoption of the Paris Agreement in December 2015. When the articles are classified according to this period division, a total of 131 articles fall within the entire timeframe (1995-2024, entire period), with 49 articles in the first 20 years (1995-2014, period I) and 82 articles in the latter 10 years (2015-2024, period II).
There were 459 keywords in total for the entire period, with 202 keywords in the period I, and 316 key-terms and 359 keywords in the period II. The frequency distribution of keywords are presented in <Table 1>, where F indicates the frequency.
In the entire period, only 16 keywords have a frequency of 10 or higher, accounting for only 3.5% of the total 459 keywords. Keywords with a frequency of 2 or less account for 356 (77.6%). Among these, keywords appearing only once total 279, accounting for 60.8% of all keywords. As shown in <Table 2>, therefore, keywords in the entire period are distributed with a small number of high-frequency ones and a large number of low-frequency ones.
In both the period I and period II also, relatively high-frequency keywords are few, while low-frequency keywords constitute the majority of the overall keywords. This frequency distribution indicates that climate change-related articles published in Environmental Policy are centered around a small number of main topics, with numerous concepts interconnected. The top 20 keywords in the three periods are shown in <Table 2>: there are slightly less than 20 keywords in the entire period, due to the tie frequency.
2. Word cloud and clusters of entire period
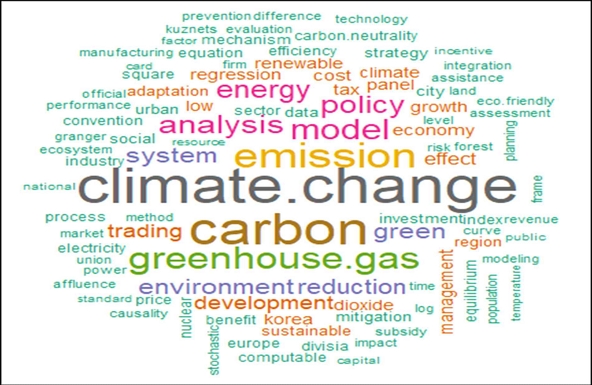
First, we examined the word cloud result. The word cloud visualization utilized degree centrality and betweenness centrality metrics to represent the degree of importance of keywords in the keyword network. Degree centrality indicates the degree of connections a keyword has with other keywords in the network; thus, the higher frequently the keyword co-occurs with others, the higher the degree centrality value (Wasserman and Faust, 1994; Kwak, 2014). Betweenness centrality, on the other hand, measures the degree to which a keyword acts as a bridge connecting two otherwise unconnected keywords in the network; thus, the more significant the pivot role a keyword plays in the network, the higher its betweenness centrality value (Wasserman and Faust, 1994; Kwak, 2014).
After being calculated for each node, the values of degree centrality and betweenness centrality were normalized to a [0, 1] scale, and their average was computed to derive a combined centrality score. To mitigate extreme differences in the values, a logarithmic transformation was applied. Only keywords with values ranking in the top 100 were included in the word cloud, effectively visualizing the importance of keywords in the network.
<Figure 3> illustrates the word cloud of keywords for the entire period. In <Figure 3> the size of words is proportional to the combined centrality score (log-transformed) and the color of words reflects their degree centrality and betweenness centrality. <Table 3> presents the keywords that are ranked within the top 20 according to their combined centrality scores.
Among these, many keywords are directly related to climate change. However, there are also keywords like Model and Analysis, which pertain to research methods or analytical models. Additionally, terms such as Trading, Economy, Tax, Cost, and Development are related to the economic aspects of climate change.
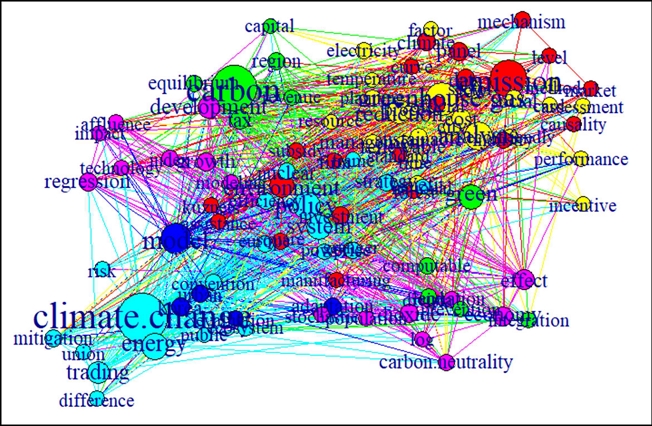
The keyword network for the entire period is visualized in <Figure 4>, where the keywords are clustered into six clusters using the Louvain algorithm. In this study, we applied the Louvain algorithm, which is widely used for community detection by optimizing network modularity. To address the algorithm’s limitation of producing different results due to random initialization, we ran the algorithm 100 times on the 100 keywords used to visualize the word cloud. Then, a stable cluster structure was constructed by selecting the most frequently assigned cluster for each node. This method provided greater reliability and consistency of clustering results, following approaches outlined in Blondel et al. (2008).
In <Figure 4>, the hubs of six clusters are Climate Change, Carbon, Emission, Greenhouse Gas, Development, and Model. Among the remaining 14 keywords in <Table 3>, Policy, Energy, System, and Trading belong to the Climate Change-cluster. Green and Tax are clustered with Carbon and Environment is clustered with Emission. Analysis, Reduction, Cost, and Renewable are interconnected within the Greenhouse Gas-cluster. Effect, Economy, and Dioxide belong to the Development-cluster. The Model-cluster does not contain any keywords ranked within the top 20 in combined centrality scores. Instead, the cluster consists of a total of five keywords: Model, Korea, Adaptation, Urban, and Evaluation.
While the keywords forming a cluster are more closely connected to one another, as observed in <Figure 4>, there are also many cases where they are closely linked across clusters. When clustering keywords from related yet distinct fields, the central themes of each field are often clearly distinguishable. However, since this study focuses on keywords related to climate-change research, active interconnections between clusters are inevitable, making it less clear what specific topics each cluster clinches. In the keyword network comparison by period presented in the following section, the temporal changes will be more clearly revealed.
3. Evolution of keyword networks: period I and II
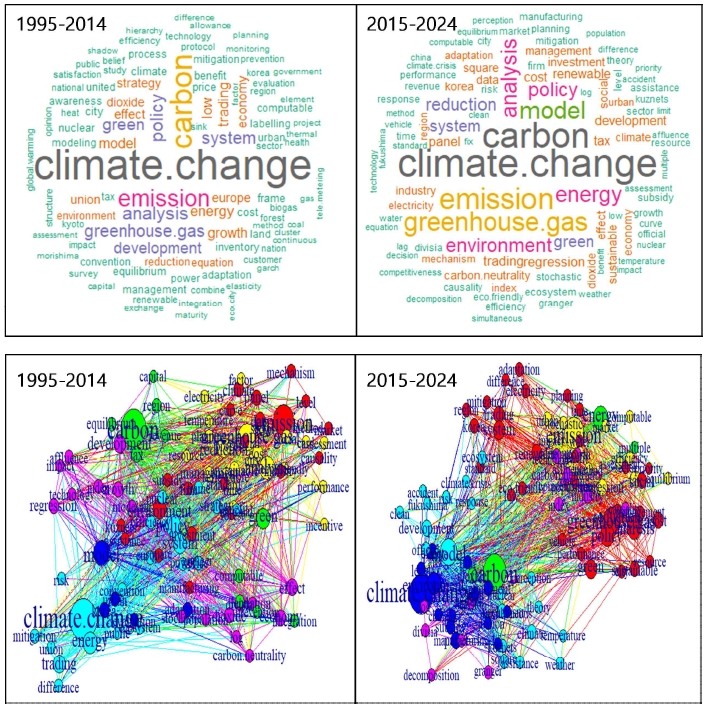
The word clouds and keyword networks were created for the top 100 high-centrality keywords from the articles in the periods 1995–2014 and 2015–2024. The result is illustrated in <Figure 5>.
<Table 4> presents the keywords that are ranked within the top 20 according to their combined centrality scores in each period.
The top three keywords, Climate Change, Carbon, and Emission, ranked in the same order, seem to indicate similarity between the two periods. As shown in <Figure 5>, however, the relative prominence of Carbon and Emission compared to Climate Change is greater in period I than in period II. Considering the significance of the concepts represented by these keywords in climate change research, this difference is meaningful. <Table 5> shows that these differences stem from the temporal changes in their centrality, indicating shifts in the intellectual structure of climate change research over time. In period I, the three keywords exhibits significant differences in degree centrality, but their degree centrality scores are distributed more evenly in period II. In betweenness centrality Carbon and Emission show little difference between the two periods. In period II, however, the betweenness centrality of Climate Change dropped significantly, decreasing from 0.412 to 0.256. This demonstrates a temporal shift from the dominant focus on Climate Change observed in period I to a more balanced distribution among Climate Change, Carbon, and Emission in period I.
The change observed in Greenhouse Gas are also noteworthy. In period I, Greenhouse Gas exhibits a degree centrality of 80, which rises sharply to 236 in period II. Even considering that the corpus for period II is approximately 1.5 times larger than that for period I, this increase is meaningful. The betweenness centrality also increases from 0.061 to 0.093, and the combined result of these two centrality measures shows a level slightly lower than, but comparable to, that of Emission. Therefore, this demonstrates the increased attention and importance of Greenhouse Gas in climate change research in period II.
This temporal change is supported by the clustered networks from the two periods. In the period I clustered network, Greenhouse Gas was part of the Carbon-centered cluster, forming a group with keywords such as Analysis and Low among those ranked within the top 20 in centrality scores. In the period II network, however, it emerged as the hub of a separate cluster, connecting with top-20 centrality keywords like Analysis, Policy, Reduction, System, Green, Trading, Cost, and Renewable.
Another temporal change worth mentioning can be found in Green, Development, Energy, Environment, and Reduction. In period I, Green was ranked 8th with a degree centrality of 80 and a betweenness centrality of 0.028. Additionally, Green served as the hub of a cluster that included keywords such as Growth, Economy, Impact, and Technology, all of which were outside the top 20 in centrality scores. In period II, however, it dropped to 12th place with a degree centrality of 112 and a betweenness centrality remaining at 0.027, and belonged to the Greenhouse-centered cluster.
Considering the number of papers and the size of the corpus between the two periods, the degree centrality of Green in period II should be regarded as having effectively weakened. This result reflects the reduced attention to Green Growth topics during period II. In period I, which includes 49 articles, Green Growth appears as a keyword 4 times. However, in period II, which includes 82 articles, it appears only 2 times.
In period I, Development was ranked 9th with a degree centrality of 76 and a betweenness centrality of 0.031. In period II, it dropped to 17th place with a degree centrality of 72 and a betweenness centrality of 0.02, indicating a decrease in its prominence as a keyword.
In contrast, Energy, Environment, and Reduction showed a significant rise in centrality over time. In period 1, Energy had a degree centrality of 64 and a betweenness centrality of 0.024, ranking 10th. In period 2, however, these values increased sharply to 174 and 0.059, elevating its rank to 6th. Environment and Reduction were ranked outside the top 20 in period 1 but entered the top 10 in period 2. In period I, Environment had a degree centrality of 42, a betweenness centrality of 0.009, and was ranked 21st. In period II, its degree centrality had increased to 142, its betweenness centrality to 0.051, and it rose to 9th place. Similarly, Reduction also gained prominence. During 1995–2014, it had a degree centrality of 40, a betweenness centrality of 0.01, and was ranked 22nd. By 2015–2024, its degree centrality grew to 142, its betweenness centrality to 0.022, and it advanced to 10th place. This change indicates that both keywords have gained greater attention and importance over time.
4. Comparative analysis of keyword networks across fields
Climate change-related studies published in Environmental Policy have been conducted across a variety of disciplines. Most studies are not based solely on a single field, making it nearly impossible to classify each study strictly within one discipline.
However, if they could be categorized by selecting a primary field for each study, the largest portion would be those analyzed from an economics-based perspective and methodology (58 out of 131 articles, 44.3%). This is followed by studies focused on policy and planning (31 articles, 23.7%). Additionally, there are studies related to other fields, including the natural sciences, as well as those exploring public perceptions, social systems, international relation, and legal aspects in relation to climate change (42 articles, 32.1%).
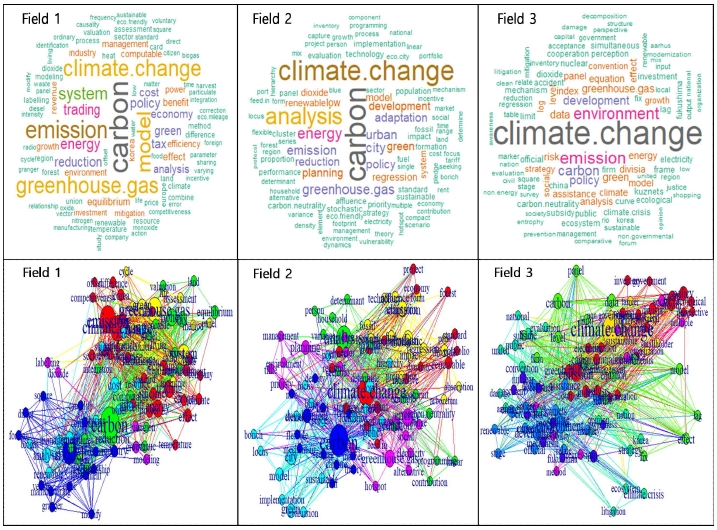
We grouped the 58 economics-based research articles as Field 1, the 31 articles on policy and planning, as Field 2, and the remaining 42 articles as Field 3. We then examined each group through word clouds and clustered networks. The word clouds and keyword networks were created for the top 100 high-centrality keywords from the articles in each field. The result is illustrated in <Figure 6>.
<Table 6> presents the keywords that are ranked within the top 20 according to their combined centrality scores in each period. In <Table 6>, the centrality scores are not included due to space constraints and instead, only the centrality rankings are provided.
In the word cloud of Field I, which includes economics-based research articles, Carbon, Emission, Climate Change, and Greenhouse Gas stand out. A noteworthy point is that the size of Climate Change in the word cloud is somewhat smaller than those of Carbon and Emission. The degree centrality and betweenness centrality of Climate Change are lower than those of Carbon and Emission: Climate Change records 192 and 0.14, compared to Carbon’s 270 and 0.22, and Emission’s 234 and 0.142, respectively. Climate Change is a constituent keyword in the Emission-centered cluster, whereas Carbon and Emission serve as the hubs of separate clusters. Therefore, this network structure suggests that Climate Change has weaker connections with other keywords compared to Carbon and Emission in this field.
Greenhouse Gas serves as the hub of another cluster. However, its centrality is lower than those of Carbon and Emission, with a degree centrality of 208 and a betweenness centrality of 0.113, similar to Climate Change. Climate Change and Greenhouse Gas have log-transformed combined centrality scores of 0.515 and 0.496, respectively, which are lower than those of Carbon and Emission, with scores of 0.693 and 0.563. This characteristic can be interpreted as indicating that, in Field 1, more attention was given to topics centered to Carbon and Emission than to Climate Change and Greenhouse Gas.
Field 2 is distinctly different from Field 1. In Field 2, Carbon and Climate Change show degree centrality and betweenness centrality values of 178 and 0.303, and 138 and 0.263, respectively. Their log-transformed combined centrality scores are 0.693 and 0.599. In comparison, Emission has values of 68, 0.033, and 0.22, and Greenhouse Gas records 72, 0.048, and 0.248. That is, contrary to Field 1, Climate Change and Carbon demonstrate significantly higher centrality than both Emission and Greenhouse Gas in Field 2. This result stems from the fact that, compared to Field 1, Field 2 shows significantly higher centrality for Climate Change and notably lower centrality for Emission. In the clustered network of Field 2, Emission is a constituent keyword in the Urban-centered cluster, whereas Carbon, Climate Change, and Greenhouse Gas are the hubs of separate clusters.
The Field 1 keyword network consists of six clusters. Apart from Carbon, Emission, and Greenhouse Gas, the hubs of the other three clusters are Cost, Growth, and Model. The Field 2 keyword network is also divided into six clusters. Notably, the hubs of the remaining three clusters, besides Carbon, Climate Change, and Greenhouse Gas, are Urban, City, and Analysis.
The roles of Model and Analysis within the network also highlight the distinction between Field 1 and Field 2 in terms of analytical approaches. In Field 1, Model records a degree centrality of 180 and a betweenness centrality of 0.132, ranking 4th in centrality, serving as the hub of a separate cluster. On the other hand, Analysis belongs to the Cost-centered cluster, with a degree centrality of 90 and a betweenness centrality of 0.017, ranking 14th.
In Field 2, the roles are reversed. Analysis becomes the hub of a separate cluster, with a degree centrality of 132 and a betweenness centrality of 0.174, ranking 3rd in centrality. Meanwhile, Model has lower centrality values of 54 and 0.01, ranking 16th, and is a constituent keyword in the City-centered cluster. This suggests that economics-based analytical methods for climate change are often associated with Model, while studies focusing on policy or planning tend to use analytical methods involving the keyword Analysis.
The prominence of Emission over Climate Change in Field 1, and the reverse in Field 2, clearly distinguishes the intellectual structures of the two fields. Additionally, the emphasis on Urban and City in Field 2 marks a key difference from Field 1, where Cost and Growth, despite not having high centrality, serve as cluster hubs.
In Field 3, Climate Change is dominantly prominent, almost functioning as a cover term. Its degree centrality and betweenness centrality are 250 and 0.544, respectively, with a log-transformed combined centrality score of 0.693. This level of centrality is overwhelmingly higher than that of the next highest, Emission, which has values of 122, 0.116, and 0.301. This can be interpreted as a natural outcome of Field 3 bringing together various approaches to climate change. Field 3 is divided into seven clusters. Greenhouse Gas belongs to the Emission-centered cluster, while Climate Change and Carbon serve as the hubs of separate clusters. In contrast to the other two fields, where their centrality was lower, Environment, Strategy, Risk, and Social act as the hubs of the remaining four clusters in Field 3.
5. Author characteristics and collaborative work
A total of 219 individuals have participated at least once as either a sole author or a co-author in the 131 climate change-related articles. Categorizing them into six groups, professor, institutional researcher, PhD, PhD student, Master and Master’s student and others, the author group statistics in the three periods are as in <Table 7>. There are cases where an individual participated as an author in both period I and period II. In <Table 7>, therefore, the sum of the results for these two periods does not necessarily match the total result for the entire period, due to overlapping authorship.
Overall, professors and researchers constitute the majority, with a slightly higher proportion of researchers. It is noteworthy that the proportion of doctoral student participation is substantially higher in the latter period, even considering the fact that the number of articles in the latter period is much greater than in the former. The differences between the other groups across periods are not meaningful.
Out of the total 219 authors, excluding the 32 individuals who participated in two or more articles, the remaining 187 authors contributed to only a single article. 7 individuals participated in 5 or more articles throughout the entire period. Among them, 1 person participated in the highest number of articles with 9, another contributed to 7 articles, and 5 individuals participated in 5 articles each. 1 person participated in 4 articles, 8 individuals contributed to 3 articles, 16 participated in 2 articles.
To examine the extent of collaboration, we investigated whether the articles published during the three periods involved co-authorship. The results are presented in <Table 8>. Overall, co-authored articles with two or more authors account for 98 articles, representing 74.8% of all articles, while single-author articles make up 33 articles, 25.2%. Articles with two authors are the most common, accounting for 53 articles, 40.5% of all articles. Articles with three or more authors represent 45 articles, making up 34.4% of the total.
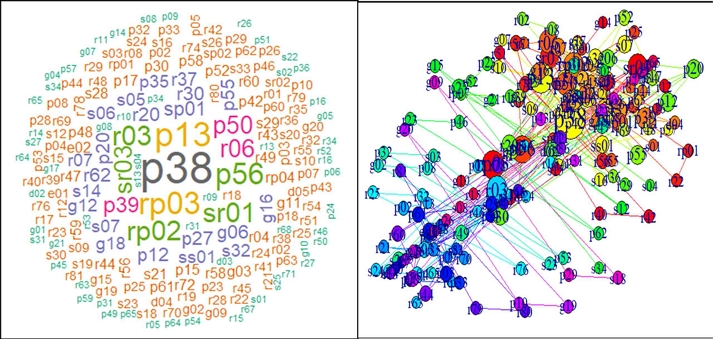
<Figure 7> visualizes the word cloud and clustered network of all authors for the entire period, where co-author relationships connect two authors as neighbors, based on their degree centrality and betweenness centrality. To understand the co-author word cloud and visualized network, it is important to know how this study assigned codes to the authors. We assigned codes to each author as follows: 65 professors were coded from P01 to P65, 81 institutional researchers from R01 to R81, 5 Ph.D. holders from D01 to D05, 34 doctoral students from S01 to S34, and 21 master’s degree holders or master’s students from G01 to G21. Additionally, 4 individuals who transitioned from researchers to professors were coded as RP01 to RP04, 2 individuals who transitioned from Ph.D. holders or doctoral students to professors were coded as SP01 and SP02, 3 individuals who transitioned to researchers were coded as SR01 to SR03, 1 individual who transitioned from a doctoral student to a Ph.D. holder was coded as SS01. The remaining 3 individuals were coded as E01 to E03.
Among the 20 authors with the highest centrality, positioned at the center of the word cloud, 12 are professors, including RP02, RP03, and SP01, who were previously researchers or doctoral students. Of the remaining 8 authors, 7 are researchers, including SR01 and SR03, who transitioned from being doctoral students, while 1, G06, is an MA student. This indicates that co-authorship is primarily facilitated through professors and researchers.
The co-author network is divided into as many as 49 clusters. The statistics of 49 clusters are presented in <Table 9>, where the cluster hub is listed only in the 7 and more member clusters.
According to the data, there are 22 isolated authors who are not connected to other authors and not presented in the network. These authors have not co-authored with others and thus remain unlinked in the network.
According to the statistics in <Table 9>, clusters with 5 or fewer members account for 35 out of the total clusters, representing 71.4% of all clusters. The cluster with the largest number of members, where P38 serves as a hub, consists of 12 members (5.5% of the total 219 participants). This indicates that there is no giant cluster in the co-author network. Therefore, this network can be characterized as consisting of a few small-to-medium-sized clusters, a majority of mini-clusters, and 22 isolated nodes.
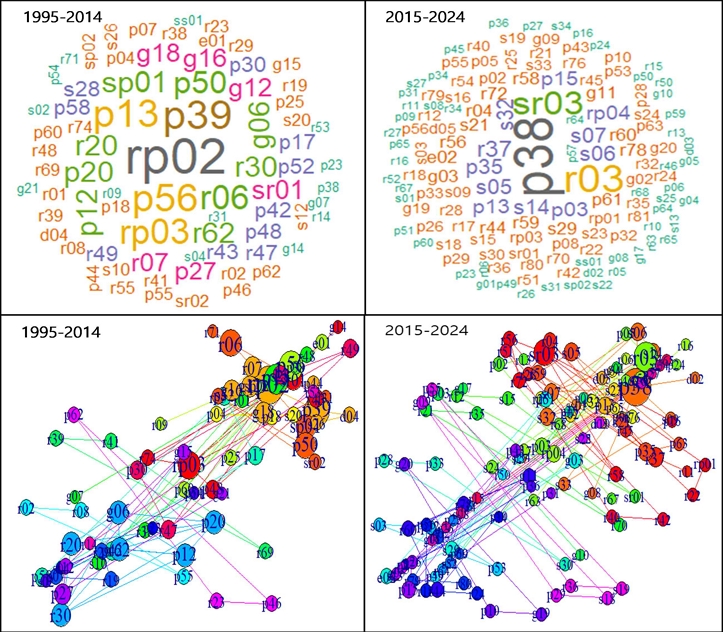
An interesting and noteworthy aspect lies in the combination of cluster members. As shown in <Table 7>, professors and institutional researchers dominate, accounting for 115 individuals, which represents 71.4% of the total participating authors. They can generally be described as relatively established and stable scholars compared to other participants, who can be regarded as emerging scholars with potential for growth as the next generation in academia. <Figure 7> shows that at least in climate change research published in environmental policy, active collaboration is occurring between the two groups, namely the professor/researcher group and the remaining group. Among the 49 total clusters, only 18 clusters (36.7%) are composed exclusively of professors, researchers, or a combination of the two. 28 clusters (57.1%) include members such as Ph.D. holders, doctoral students, master’s degree holders, or master’s students alongside professors or researchers. Additionally, 3 clusters with two members each are composed of a doctoral student paired with a master’s degree holder or a master’s student. Notably, among the 13 clusters with 5 or more members, only two consist exclusively of professors/researchers, without the involvement of other types of authors. <Figure 8> illustrates the co-author word clouds and networks for period I and period II.
Comparing period I and period II shows that co-authorship has increased over time. During period I, single-author articles accounted for 15 out of 49 articles (30.6%), while articles with two or more authors made up 34 articles (69.4%). Among the 85 authors involved in period I, 10 (11.76%) are isolated in the clustered network because they have not co-authored with others. These 10 authors come from a total of 15 single authors.
In contrast, during period II, single-author articles totaled 18 out of 113 articles, 22%, while those with two or more authors increased to 64 articles, 78%. Among the 150 authors involved in period II, 15 (10%) are isolated in the clustered network because they have not co-authored with others. These 15 authors come from a total of 18 single authors. The number of clusters also differs between the two periods. The period II network forms 43 clusters while the period I network consists of 18 clusters. These points suggest that co-authorship was more active during period II. The statistics on authorship for each of Field 1, Field 2, and Field 3 are presented in <Table 10>.
Among 58 articles in Field 1, 16 articles (27.6%) are single-author ones, while 42 articles (72.4%) were co-authored by two or more authors. In contrast, Field 2 exhibits a significant difference in co-authorship patterns, with only 3 single-author articles (9.7%) out of 31 articles, and the majority, 28 articles (90.3%), being co-authored. This highlights a notable contrast in co-authorship of other two fields. Field 3 also contrasts with Field 2. Out of the 42 articles in Field 3, 14 articles are single-author ones, accounting for 33.3% of the total.
IV. Discussion: Implications and Limitations
The keyword networks examined in this study reveal that among the terms used to select climate change-related articles, Climate Change, Carbon, and Greenhouse Gas interconnect actively with other keywords and serve as intermediaries, forming main topics. In addition, Emission, Energy, Policy, Reduction, Environment, Trading, Analysis, and Model are also prominent. The prominence of Analysis and Model is a result of keywords frequently referencing analytical methods and model types, such as Decomposition Analysis, Cost-Benefit analysis, Computable General Equilibrium Model, and Integrated Assessment Model.
Unexpectedly, however, Global Warming, Climate Crisis, Carbon Neutrality, and Net Zero receive relatively little attention. Global Warming, which was observed only once, is a competing term that conveys a similar meaning to Climate Change. The minimal use of Global Warming seems to be due to a tendency to use Climate Change instead when referring to this concept (Yun and Kim, 2024). The reason for this tendency is that Climate Change is used in international negotiations, international events, and major reports such as the United Nations Framework Convention on Climate Change (UNFCCC), the Conference of the Parties (COP) to the UNFCCC, and IPCC’s Climate Change Assessment Report.
Yun and Kim (2024) observed a similar pattern in which Climate Change was used far more frequently than Global Warming before the publication of the IPCC AR6 in 2023 (IPCC, 2023). As the severity of Global Warming was emphasized, however, it was used with almost equal frequency to Climate Change in the IPCC AR6 (Yun and Kim, 2024: 286). Whether Global Warming will become a key-term in Korean academia remains to be seen.
Apart from its use within Climate Change, Climate also co-occurred with other keywords 8 times. Climate Crisis, which also includes Climate, occurred only twice and received relatively little attention. This suggests that Climate Crisis has not yet become a prominent concept in academic discourse. Over the 30-year period, a similar pattern is observed for Carbon Neutrality and Net Zero. All six occurrences of Carbon Neutrality appeared in period II. Net Zero appeared only once during this timeframe. Both terms gained prominence in academic discourse following the publication of the Special Report on Global Warming of 1.5°C in 2018 (IPCC, 2018).
The intellectual structure over time indicates a shift from a leading position of Climate Change during period I to a diversification into topics such as Carbon, Greenhouse Gas, and Emission during period II. Additionally, some topics have received less attention over time, while others have gained prominence. For example, Green Growth and Development belong to the former, while Reduction and Environment belong to the latter. A comparison by subfields shows that in economics-based fields, more attention is given to Emission, and Carbon than to Climate Change compared to the other fields. Through the analysis of the co-author network, we found that professors and researchers actively collaborated with the next generation of academics. Over time, co-authorship has become increasingly frequent and dynamic.
The findings of this study do not claim to absolutely represent the intellectual structure of climate change-related academia. To gain a more detailed understanding of the characteristics of Korean climate change-related academia, it would be valuable to analyze articles from other climate change-related associations, such as the Korean Association for Environmental Sociology or the Korean Society of Climate Change Research, using the same method as this study and comparing the results. Additionally, analyzing the remaining articles published in Environmental Policy, which were not included in this study’s analysis, could help identify the common characteristics among articles published in Environmental Policy and the unique features of climate-change related articles.
Expanding the scope further, it would also be possible to compare the academic themes and trends of Korean climate change research with those in the global academic community. To achieve this, the intellectual structure of articles published in international or foreign journals on climate change could be analyzed and compared with the findings of this study.
Despite its value, this study has several limitations. It is self-evident that merely analyzing the keywords in the keywords section of articles cannot fully capture the intellectual structure of a discipline. To address this limitation, the analysis could expand the corpus to include sentences from abstracts. This approach may help uncover critical aspects missed in the keyword analysis.
Lastly, the clustering method warrants discussion. This study applied Louvain algorithm to identify clusters within the network. Louvain algorithm is a method that detects clusters by maximizing modularity (Blondel et al., 2008). While this method has many advantages, it is not the only clustering approach. Using alternative methods may not lead to significantly different results but could yield variations in clustering structures. It would be ideal to compare and analyze clustering results using alternative techniques. However, this study relied solely on the Louvain algorithm, which remains a limitation.
Ⅴ. Conclusions
This study aimed to examine the intellectual structure of climate change research in Korean academia, focusing on articles published in Environmental Policy for 30 years from 1995 to 2024. The primary objective was to identify key topics, temporal and subfield trends and collaborative patterns in the field. The findings showed that the core focus of many studies is formed with Climate Change, Carbon, Emission, and Greenhouse. This study observed temporal changes in the intellectual structure. It also identified differences in focus among the various approaches to analyzing climate change. The co-author network analysis highlighted the active involvement of professors and researchers, who constituted the majority of contributors. It also revealed significant co-authorship between senior scholars and emerging researchers, demonstrating an interdisciplinary and inclusive approach to research.
Despite its contributions, the study has limitations. It may have oversimplified topic relationships or missed alternative clustering patterns. Future research should broaden the scope to include abstracts and compare results using alternative clustering methods to achieve a more comprehensive understanding.
This study provides a valuable foundation for understanding the intellectual landscape of climate change research in Korea and offers insights for future comparative studies, both domestically and internationally. Expanding analytical approaches can further enhance our understanding of the evolving dynamics of this critical field.
Acknowledgments
This research was supported by the BK21 FOUR funded by the Ministry of Education and National Research Foundation of Korea (No. 5120200113713). We would like to express our gratitude to Nuri Bae, Jihun Ha, and Soongil Choi, PhD candidates, You-Jin Cho, a PhD student, and HyoJeong Choi, Bogyeong Kim, Urisarang Kim, Jiyeon Lee, Seungeun Lee, Jin Long, YuJeong Park, master’s students, from the Graduate School of Environmental Studies at Seoul National University, for their assistance in collecting research data.
Notes
References
-
Blondel, V. D., J. L. Guillaume, R. Lambiotte, and E. Lefebvre, 2008, “Fast unfolding of communities in large networks,” Journal of Statistical Mechanics: Theory and Experiment, 2008, 10, P10008.
[https://doi.org/10.1088/1742-5468/2008/10/P10008]

-
Faraji, O., K. Asiaei, Z. Rezaee, N. Bontis, and E. Dolatzarei, 2022, “Mapping the conceptual structure of intellectual capital research: A co-word analysis,” Journal of Innovation and Knowledge, 7(3), 100202.
[https://doi.org/10.1016/j.jik.2022.100202]

-
Freeman, L., 1979, “Centrality in social networks: Conceptual clarification,”Social Networks, 1, 215-39, Retrieved from https://bebr.ufl.edu/sites/default/files/, .
[https://doi.org/10.1016/0378-8733(78)90021-7]

- He, Q., 1999, “Knowledge discovery through co-word analysis,”Library Trends, 48(1), 133-159, Retrieved from https://www.ideals.illinois.edu/, .
-
Hellsten, I., and L. Leydesdorff, 2016, “The construction of interdisciplinarity: the development of the knowledge base and programmatic focus of the journal Climatic Change, 1977–2013,” Journal of the Association for Information Science and Technology, 67(9), 2181-2193.
[https://doi.org/10.1002/asi.23528]

- Intergovernmental Panel on Climate Change (IPCC), 2014, Climate change 2014: Synthesis report. Contribution of Working groups I, II III to the Fifth Assessment Report of the Intergovernmental Panel on Climate Change. Cambridge University Press, Retrieved from https://www.ipcc.ch/report/ar5/syr/, .
- Intergovernmental Panel on Climate Change (IPCC), 2018, ‘Global warming of 1.5°C. An IPCC special report on the impacts of global warming of 1.5°C above pre-industrial levels and related global greenhouse gas emission pathways, in the context of strengthening the global response to the threat of climate change, sustainable development, and efforts to eradicate poverty’. In V. Masson-Delmotte, P. Zhai, H. O. Pörtner, D. Roberts, J. Skea, P. R. Shukla, ... T. Waterfield (Eds.). World Meteorological Organization, Retrieved from https://www.ipcc.ch/sr15/
-
Intergovernmental Panel on Climate Change (IPCC), 2023. Climate change 2023: Synthesis report. Contribution of Working groups I, II III to the Sixth Assessment Report of the Intergovernmental Panel on Climate Change [Core Writing Team, H. Lee and J. Romero (eds.)]. IPCC, Geneva, Switzerland, 35-115.
[https://doi.org/10.59327/IPCC/AR6-9789291691647]

- Kim, S.-H., and S.-J. Yun, 2015, “The Knowledge structure of environmental sociology in Korea: Based on the co-word analysis of article titles in ECO,”ECO, 19(2), 165-211, Retrieved from https://www.dbpia.co.kr/journal/
- Kwak, K.Y., 2014, Social network analysis, Seoul: Chungram.
- OpenAI, 2024, ChatGPT (GPT-4.0) [Language model]. OpenAI. https://chat.openai.com
- R Core Team, 2024, R: A language and environment for statistical computing. R Foundation for Statistical Computing, Vienna, Austria. https://www.R-project.org/, .
-
Romo-Fernández, L. M., V. P. Guerrero-Bote, and F. Moya-Anegón, 2013, “Co-word based thematic analysis of renewable energy (1990–2010),” Scientometrics, 97, 743-765.
[https://doi.org/10.1007/s11192-013-1009-5]

- Seong, J. C., C. S. Hwang, C. S., A. Stanescu, Y. Lee, and Y. Lee, 2022, “What geographers research: An analysis of geography topics, clusters, and trends using a keyword network analysis approach and the 2000-2019 AAG conference presentations,” International Journal of Geospatial and Environmental Research, 9(1), 1-18, Retrieved from https://dc.uwm.edu/ijger/, .
-
Uc-Castillo, J. L., A. E. Marín-Celestino, D. A. Martínez-Cruz, J. Tuxpan-Vargas, and J. A. Ramos-Leal, 2023, “A systematic review and meta-analysis of groundwater level forecasting with machine learning techniques: Current status and future directions,”Environmental Modelling and Software, 105788.
[https://doi.org/10.1016/j.envsoft.2023.105788]

-
Wasserman, S., and K. Faust, 1994, Social network analysis: methods and applications, Cambridge University Press., Cambridge: United Kingdom.
[https://doi.org/10.1017/CBO9780511815478]

- Watts, D. J., 2004, Six degrees: The science of a connected age, W. W. Norton & Company, New York: NY.
-
Yun, S.-J., and S.-H. Kim, 2024. “A diachronic analysis of word frequency in IPCC reports: exploring shifts in climate change discourse,”Studies in Linguistics, 73, 271-302.
[https://doi.org/10.17002/sil..73.202410.269]

Sun-Jin Yun: She is a professor at the Graduate School of Environmental Studies at Seoul National University. After graduating from the Department of Sociology at Seoul National University, she earned a master’s degree in Urban Affairs and Public Policy and a Ph.D. in Environmental and Energy Policy from the University of Delaware in the United States. Her primary research interests include the climate crisis, carbon neutrality, and energy transition. Her work focuses on understanding how members of society perceive these issues, seek solutions for change, and drive transformation, employing approaches from policy studies, environmental sociology, and environmental education(ecodemo@snu.ac.kr).
Sun-Hoi Kim: He is a professor in the Department of English Language and Literature at Chung-Ang University. He earned his bachelor’s and master’s degrees in English Education from Seoul National University and obtained a Ph.D. in Linguistics from the University of Delaware in the United States. His primary research interests include phonology, corpus linguistics, and quantitative analysis of languages(sunhoi@cau.ac.kr).
