Understanding the Impacts of Land Cover Change on Water Quality in an Urbanized Stream
Abstract
The heavily urbanized Johnson Creek watershed in the Portland, Oregon metropolitan region has experienced degraded water quality and historic mismanagement for decades. This paper reviews previous work on urbanized watersheds as well as studies that have explored Johnson Creek itself. Analysis of those previous studies is used to determine the present water quality within Johnson Creek and aims to predict how development and restoration will impact future water quality. While tracking water quality, stream temperature, total suspended solids (TSS), land cover metrics, extent of development, and canopy cover, this research expatiates on the effect of rising temperatures, the need for more responsive sediment transport, and increased spatial development within all portions of the watershed. Ultimately, this author has concluded that increased sunlight exposure through solar radiation loads on streams as a result of human-generated disturbances is a significant cause of stream temperature warming and the deterioration of water quality. Despite numerous and long-standing efforts for public-private cooperative stream restoration, the water quality in the Johnson Creek watershed continues to deteriorate.
Keywords:
Water Quality, Land Cover Change, Urban Stream, Stream Restoration, Johnson CreekI. Introduction
Urbanization within the Johnson Creek watershed and human modification of the stream itself have been the primary drivers in decreasing water quality. This paper addresses how historic land use changes and their relation to stormwater runoff have created the current condition of the stream, which has been listed as an impaired under section 303(d) of the U.S. Clean Water Act. The focus of this study will center around two water quality variables, temperature and total suspended solids (TSS), analyzing the impact of land use change and stream restoration efforts on each variable. This team will utilize existing bodies of water quality, land use, infrastructure, and restoration data to analyze historic relationships between the increasing human footprint in the Johnson Creek watershed and the decline in water quality. Specifically, this paper addresses the impact of stormwater infrastructure, riparian tree canopy, and land use changes associated with the increasing urbanization of the watershed in the period between 2000 and 2012.
Ⅱ. Literature Review
Urbanization has been a significant driver for stream modification such as impervious rate change. According to Morrill et al. (2005) and JCWC (2005a), the amount of effective impervious surface within a watershed indicates a negative correlation with overall watershed health. Bolstad and Swank (1997) argue that water quality variables indicate different trends during different flow conditions (summer and winter season). They compared baseflow with stormflow to understand the influence of land use on water quality change such as water temperature. Chang (2006) and Chang et al. (2005) researched Impacts of land use change on hydrologic characteristics such streamflow change from the data by researching cases in Oregon and Pennsylvania. Moreover, water temperature in streams is a significant variable in evaluating water quality and health of ecosystem (Morrill et al., 2005).
Stream ecosystems are heterogeneous landscapes of interacting subsystems. They are strongly connected to surrounding terrestrial and downstream recipient ecosystems (Grimm et al., 2005). Some studies indicate that spatial interactions with other aspects of the urban landscape are important determinants of variability in stream biota (Walton et al., 2007). It is reasonable to consider the empirical evidence on the effects that patterns of urban development have on ecosystem function as urban development fragments, isolates, and degrades natural ecosystems, simplifies and homogenizes species composition and diversity, disrupts hydrological systems, and modifies energy flow and nutrient cycling (Alberti, 2005). Within Johnson Creek, urban development is a significant factor, affecting the hydrological cycle. Salmon are one of many different species which benefit from a healthy stream. Currently, restoration projects are being done to help revitalize salmon populations (JCWC, 2005b). One critical factor to consider is canopy cover, in particular forest canopy and the impact it has on stream temperature. Solar radiation is one of the most significant physical variables to control when dealing with stream restoration (Roth, 2002). Efforts can be made to protect fish habitats by increasing riparian vegetation to reduce solar radiation absorbed by the water, lowering maximum water temperatures (Roth, 2002).
Stormwater is a well-known driver of stream degradation in urban areas (Paul and Meyer, 2001; Walsh et al., 2005). In many cases, the increased impervious surface cover in cities, connected directly to streams via networks of storm drains, has the effect of increasing both the volume and flashiness of in-stream stormwater flows (Arnold and Gibbons 1996; Leopold, 1968). This hydrological change then causes physical changes in stream morphology (Arnold et al., 1982; MacRae, 1997), water chemistry (Hatt et al., 2004) and stream biology (Roy et al., 2005; Stepenuck et al., 2002; Wang and Lyons, 2003). The negative impact of stormwater runoff in streams is not unique to urban areas. According to the United States Environmental Protection Agency (USEPA), agricultural lands are the main cause of water quality problems in the United States (Environmental Protection Agency, 2002). The main water quality issues associated with agricultural areas are bacteria, nutrient and chemical levels, and sediment.
The tie from restoration to the health of the stream has a direct relation from the land use regulations and the change in land cover; and the canopy cover to the temperature of the water (Dent et al., 2005). Here this researcher can find a correlation between the amount of tree canopy removal and the amount of precipitation and or the evapotranspiration that happens in response (Jones, 2000). Research on shallow land-sliding, root reinforcement, and the spatial distribution of trees helps to compare how the root structure of local species plays a role in the formation of the slope of the banks and to which rate they erode (Roering et al., 2003). These are based upon learning what the spatial distributions are as well as the strength of the roots of a particular species. Being able to quantify and map root structures to help hold erosion back allows for the scarred areas to rehabilitate and regenerate, stabilizing the hillside.
Ⅲ. Data and Methods
1. Study Site
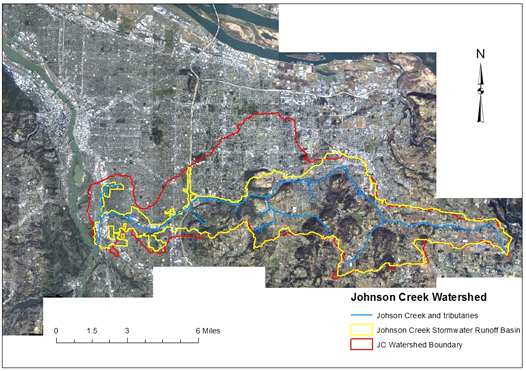
Johnson Creek flows 42 kilometers from the foothills of the Cascade Mountains west into the Willamette River just upstream of Portland, Oregon <Figure 1>. The Johnson Creek watershed has a temperate marine climate typical of the Willamette Valley, on average receiving two-thirds of its 100-150 cm of precipitation a year between the months of November-March, almost exclusively as rain. Because of the seasonal variation in rainfall, as almost no rain falls in the basin between July and October, summer flow in the basin is almost exclusively supplied by groundwater sources, while flow throughout the rest of the year is provided by precipitation runoff. Although mainly agricultural near the headwaters in unincorporated Multnomah and Clackamas Counties, much of the land throughout the 140 square kilometer watershed is urbanized, including 175,000 residents living throughout large areas of Portland and Gresham as well as portions of Milwaukie, Happy Valley, and Damascus (JCWC, 2003). Channelization throughout both agricultural and urban sections of the creek is typical, with the lower 24 kilometers having been lined with rock in the 1930’s as part of a federal flood-prevention project. Ironically, Johnson Creek continues to pose flooding problems to nearby residents, in addition to exhibiting degraded water quality typical of urbanized streams. Despite elevated temperatures and toxics levels, Johnson Creek still supports small populations of salmonids, including native coho and Chinook salmon, as well as steelhead and cutthroat trout (JCWC, 2012a). For this reason, Johnson Creek has been the focus of restoration efforts in recent years aimed at increasing water quality and viable habitat (Levell and Chang, 2008).
Kauffman et al. (2010) and ODEQ (2010) argue that riparian vegetation and canopy ratio in watershed and riparian areas have a significant impact on various stream temperature changes within Johnson Creek. ODEQ states that these riparian corridors and riparian buffer zones bring about a microclimate that surrounds the stream, where cooler air temperatures, higher relative humidity, and lower wind speeds are characteristic. Consequently, canopy cover ratio changes in Johnson Creek is one of the most important factors for understanding water quality issues, as vegetation changes in the riparian corridors are associated with water temperature change. The ODEQ has developed a draft total maximum daily load (TMDL) for Johnson Creek’s temperature. The numerous investigations of temperature in Johnson Creek over the years have consistently indicated that elevated temperatures are a problem throughout the watershed (Koehler, 2004).
To sum up, many previous studies on Johnson Creek concluded that its water quality is very poor (JCWC, 2005a). Oregon Water Quality Index by ODEQ ranges from 10 (worst) to 100 (ideal water quality), but Johnson Creek’s score were less than 60 for more than decade (DEQ, 2010). Consequently, urbanization influenced these flow levels because of expansion impervious areas. Peak flows normally occur in winter rain season. Summer low flows in July, August and September reflecting minimal groundwater contributions to streamflow in watershed (JCWC, 2005b). Even though many previous researches studied Johnson Creek, Johnson Creek has been struggling to have a successful restoration bringing good water quality back to it, so our study will try to suggest effective solutions for having improved water quality in Johnson Creek.
2. Data
Water quality data used in this study consisted of 2000-2010 water temperature data taken from USGS monitoring stations at Regner Road (USGS gage # 14211400), Sycamore (# 14211500), and Milwaukie (#14211550), and TSS data, collected by the Portland Bureau of Environmental Services. TSS data consists of grab samples taken at 3 sites (Regner Road, SE 158th Ave, and Umatilla St. Bridge) from 2003-2010 on an approximately monthly basis, in all seasons and weather conditions. Sites chosen are located in the upper, middle, and lower portions of the watershed and correspond with the USGS gages, which also provided flow data. Daily air temperature data from 2000 to 2005 was collected from National Oceanic and Atmospheric Administration (NOAA) database.
Spatial data includes the watershed boundary, obtained from the State of Oregon, and stormwater basin boundary, developed by Multnomah County in consultation with municipalities in the watershed <Figure 1>. Data on developed land cover, canopy, and floodplain expanses was obtained from the Regional Land Cover Information System (RLIS) database, maintained by the Metro regional government.
3. Methods
The focus area of this study consisted of stormwater basin boundaries, called storm-watersheds, developed for each stream gage. Because of the heterogeneous stormwater management practices employed by jurisdictions within the watershed, it was decided that gage strom-watersheds would represent land areas with the most direct relationship with Johnson Creek.
This study analyzed water temperature data for the years 2000-2010 and used the Spearman rank correlation model to determine the relationship between air temperature and water temperature patterns at gage stations during summer seasons from 2000-2005. In a previous study, Chang et al. (2005) used Spearman’s rank correlation model to understand influence of land cover to water quality. The seven-day average of daily maximum temperature (hereafter called as 7DADM) was calculated to compare summer water temperatures over temporal and spatial scales, from 2000-2010 at each gage, then compared to canopy cover rates developed for each strom-watershed. The significance of all statistical analyses was tested by SPSS 26.
To analyze the impact of stormwater on TSS within the Johnson Creek Watershed, data for TSS and flow were related on both spatial and temporal scales in order to analyze differences within upper, middle, and lower portions of the watershed as well as the dynamics of change between the 3 different time periods for which continuous data was available, 2003-2005, 2006-2007, and 2008-2010.
Temperature and TSS/flow results were then related to land cover, using two metrics, canopy cover and development. In order to compare temperature and canopy, the area of canopy cover within a 100 meter buffer around the creek and its tributaries was calculated within each strom-watershed. For TSS analysis, the area of developed land was calculated both within gage storm-watersheds as well as within a 100 meter buffer around the creek and its tributaries within each strom-watershed.
Restoration efforts were also related to temperature analysis by reviewing restoration activities focused on increasing canopy cover around each of the three stream gages used in this study. Analysis of restoration plans was also undertaken, reviewing changes in priorities set forth in plans from 1991-2012.
This researcher examines a hypothesis that the number of exceeded seven-day average of daily maximum temperature (7DADM) and averaged daily maximum water temperature during the summer increase with urbanization influences, due to canopy ratio changes in the riparian near-area of Johnson Creek. Many previous studies have reviewed water quality issues in Johnson Creek between the 1900s and the 1990s, however much restoration work has been undertaken along the creek in the last decade in an attempt to control temperature. Therefore, this paper will focus on the impact of restoration work on stream temperature in the period 2000-2010.
Finally, this author discusses the relationship between water quality and stream flow under the urbanization pressure within the watershed from 2003-2010, based upon the results of data analysis with regard to hydroclimate, land-use, and restoration. Levels of sediment transport are expected to be highest during high flow periods, especially during storm events. This study also assess changes in this relationship over time, comparing 3 successive time periods (2003-2005, 2006-2007, 2008-2010), and space, comparing data from gauges in the upper, middle, and lower portions of Johnson Creek. Differences in stormwater management infrastructure and land cover within the watershed are expected to result in the majority of sediment being sourced from upper, agricultural portions of the creek.
Ⅳ. Results and Discussions
1. Hydroclimate
Flow level change has an inverse proportion correlation between water temperature since 1999 (<Figures 2, 3, 4>). One of the serious issues in Johnson Creek is low stream flow during summer, which has caused high water temperatures. Furthermore, this high stream temperature (water temperature) issue is associated with air temperature change in Johnson Creek. Sinokrot and Stefan (1993) state that air temperature directly affects water increases in water temperature. Thus, our study collected air temperature data observed downstream (Milwaukie) from 2000 to 2005 <Figure 6>.

Averaged daily streamflow and water temperature (°C) in Milwaukie, Johnson creek from 1999 to 2010 (cms: cubic meter per sec.)

Averaged daily streamflow and water temperature (°C) in Sycamore, Johnson creek from 1999 to 2010 (cms: cubic meter per sec.)

Averaged daily streamflow and water temperature (°C) in Regner, Johnson creek from 1999 to 2010 (cms: cubic meter per sec.)

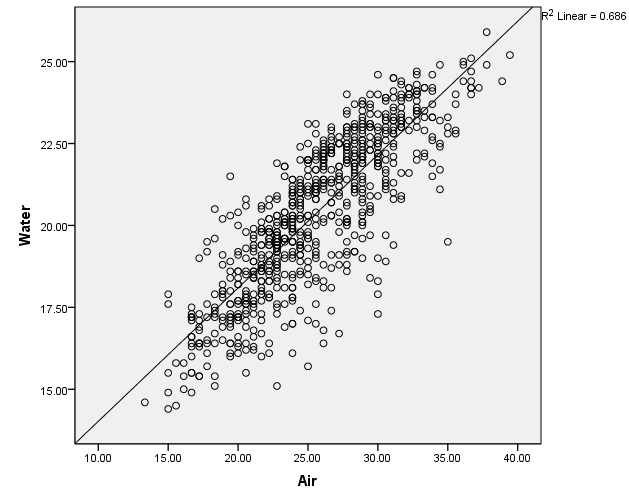
Correlation coefficient between daily maximum air temperature and daily maximum water temperature in Johnson creek 2000 to 2005
The results of our research indicated the importance of land cover factors in understanding stream temperature in the Johnson Creek watershed in Oregon (Lalli and Parsons, 1997). The effects of human modification in Johnson Creek have caused an increase in stream temperature, and elevated water temperatures are very harmful to aquatic organisms. In addition, water temperature partially determines the concentration of dissolved oxygen and carbon dioxide, which are profoundly linked with biological processes.
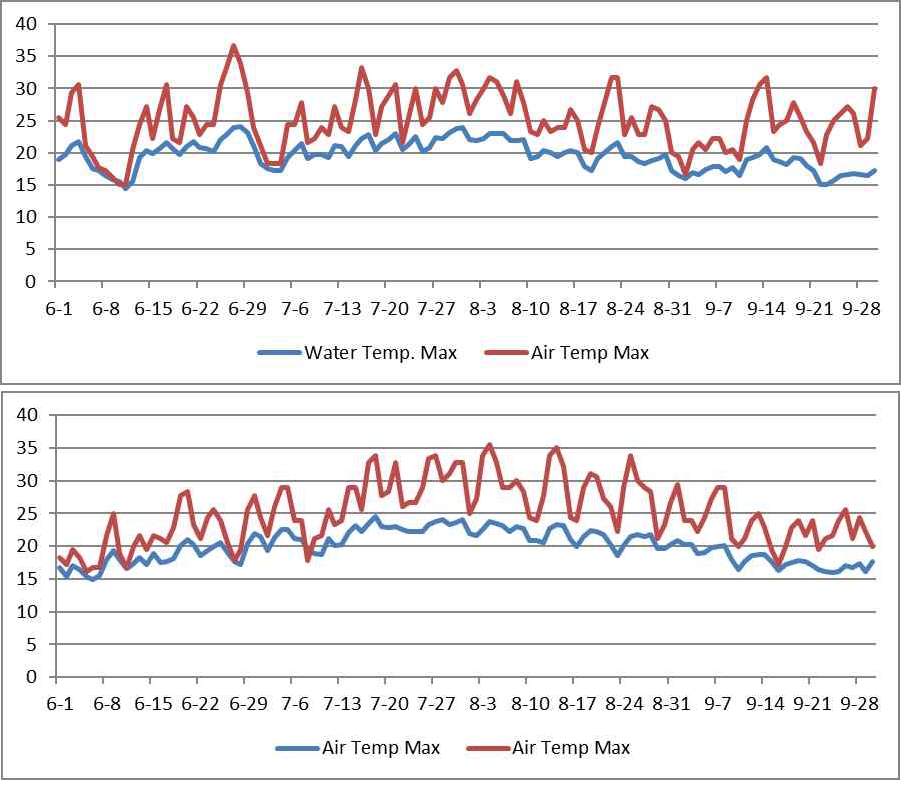
The following graphs indicate air temperature and water temperature change patterns during summer days (low-stream flow season) in Johnson Creek. The day with the highest recorded air temperature had the highest water temperature in the graphs. Thus, this researcher can conclude that summer water temperature of Johnson Creek is largely controlled by air temperature (Correlation coefficient value=.829).
Johnson Creek indicated many of usual problems of urban streams, such as poor water quality. This researcher observed the poor water quality through our analysis of summer water temperatures in Johnson Creek. Sub-basin land cover variables, such as canopy cover rate, can be associated with water temperature change. The author conclude that existing land cover patterns will continue to decrease water quality with higher water temperatures if one does not provide any mitigation solutions for this issue in Johnson Creek.
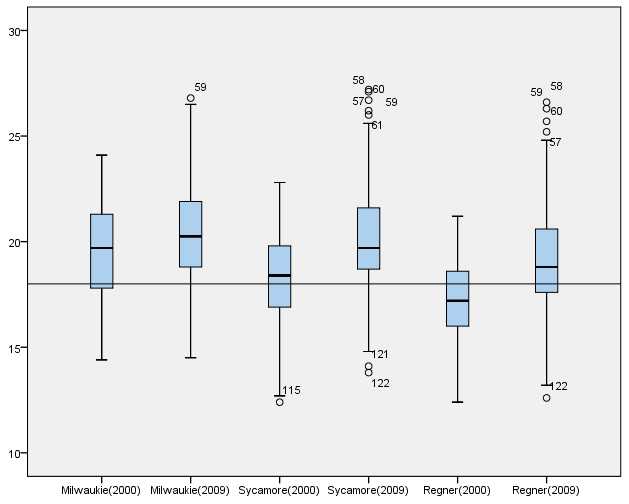
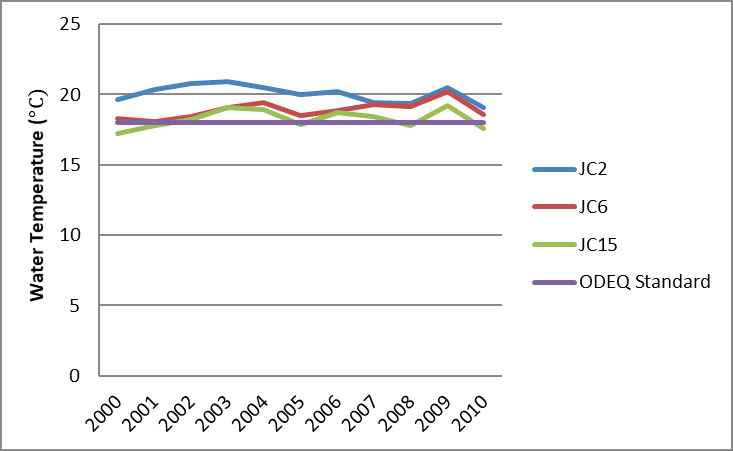
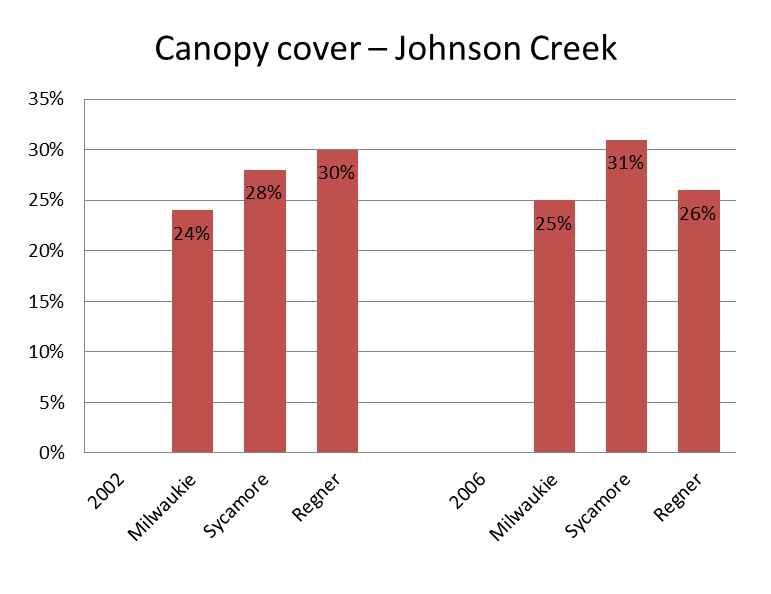
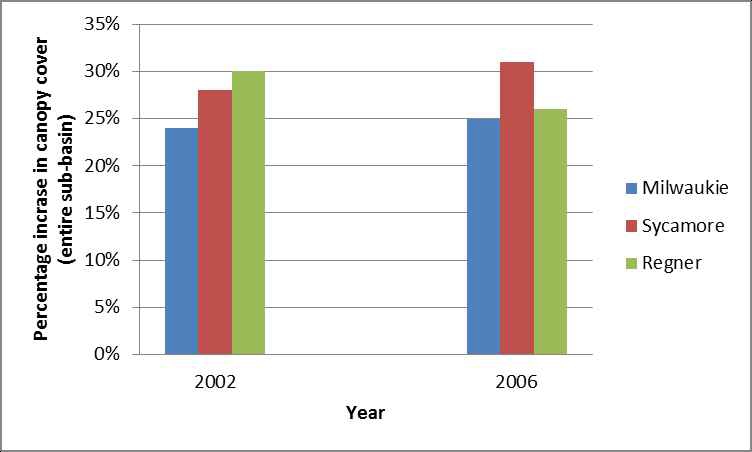
In <Figure 8>, the average daily maximum water temperature at most Johnson Creek gauging stations during the summer were observed to be higher than the state standard. The canopy cover rate in Johnson Creek was measured for evaluating land cover change between 2006 and 2010. Isaac et al. (2010) argue that solar radiation within 1 Km of watershed buffer areas is a major factor in stream temperature change. Thus, this researcher collected canopy cover rate data at Milwaukie, Sycamore, and Regner in 2002 and 2006 <Figure 9>.
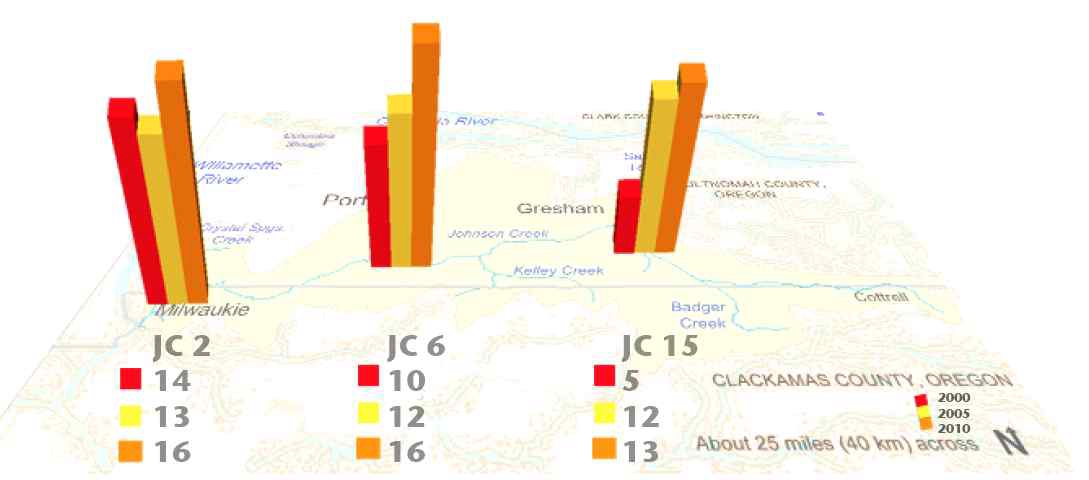
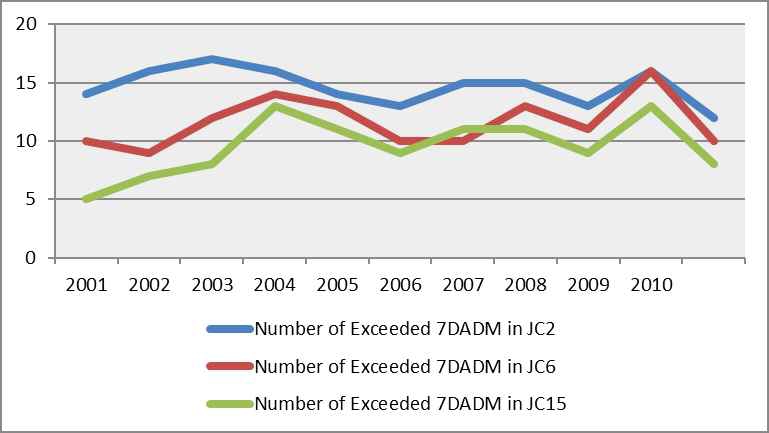
The canopy cover rate at Milwaukie in 2006 did not change much compared with 2002. On the other hand, Regner showed an obvious decrease, from 30% to 26%, while the canopy cover rates at Milwaukie and Sycamore in 2006 indicated small increases. The trend of canopy cover ratio change indicates a decrease in overall canopy cover rate in Johnson Creek. These rate changes are associated with riparian vegetation change and development in the upper stream of Johnson Creek. After development upstream, riparian vegetation no longer provides enough shade to keep stream temperatures from rising in the Johnson Creek watershed area, indicating that water temperature during the summer is influenced by canopy cover ratio. This researcher analyzed 7DADM during the summer, from 2000 to 2010, to examine our assumption that decreased canopy cover rate brings about increased water temperature, using the Johnson Creek case. The number of weeks that stream temperatures exceeded the standard temperature of 18.0°C stated by ODEQ was 14 in 2000 and 16 in 2010 at Milwaukie, and 10 in 2000 and 16 in 2010 at Sycamore. Both Milwaukie and Sycamore show increased values in 7DADM evaluation. Regner had 5 weeks of temperatures above the standard in 2000 and 13 in 2010, an increase of 160%.
Consequently, this researcher was able to conclude that canopy cover rate influenced water temperature in Johnson Creek, because Regner had a reduced canopy cover rate and remarkably increased 7DADM value in the analysis (<Table 2> and <Figure 11>).
2. Land Cover
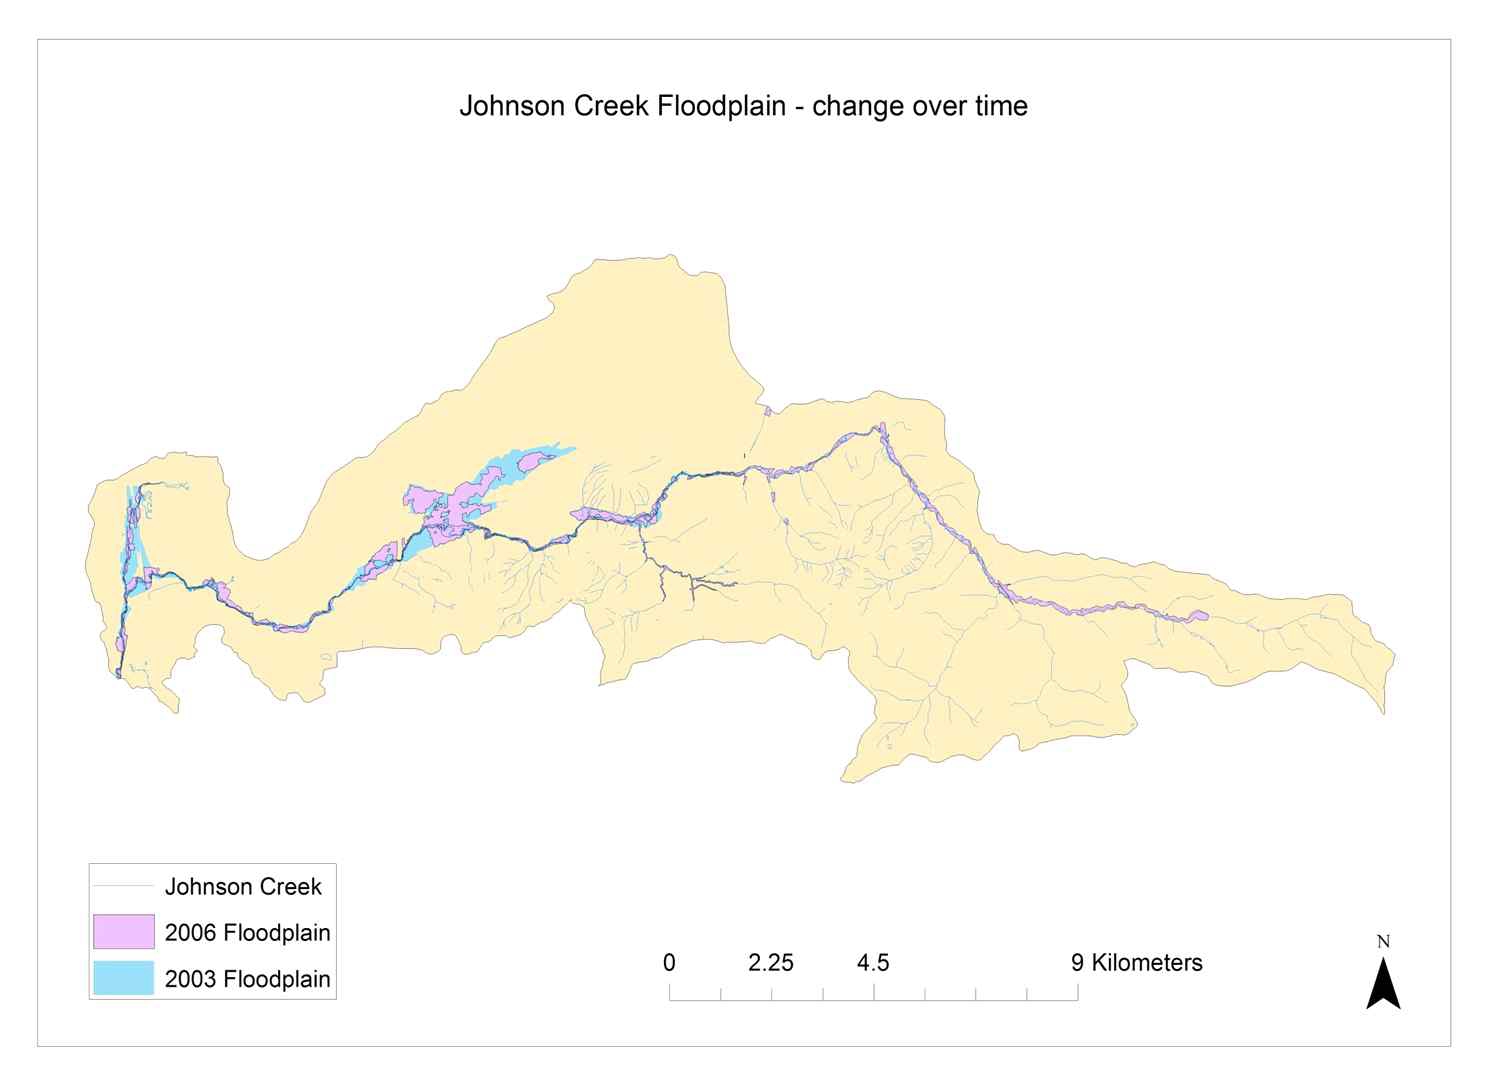
For floodplains, this researcher compared data from 2003 and 2006 and noted, while some areas of Johnson Creek had seen a significant decrease in the floodplains others saw expansion <Figure 12>.
For vegetation the focus was on canopy cover. Forest canopy in particular is important as it has the biggest effect on stream temperature and thus, water quality (Roth et al., 2010). In examining the overall area of the sub-basins, the lower sub-basins, Milwaukie and Sycamore, the forest canopy increased. In the upper sub-basins forest canopy decreased. Sycamore showed the biggest increase with a 3% gain while Milwaukie had a gain of 1%. Regner decreased by 4%<Figure 13>.
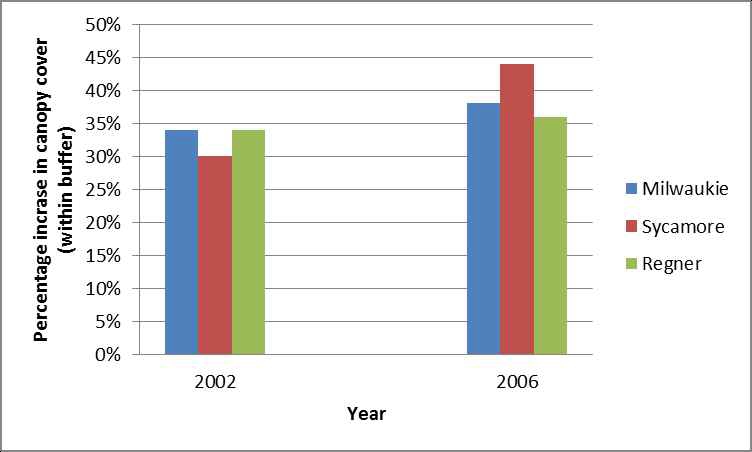
In examining the buffer data for canopy cover <Figure 14>, changes were more pronounced within the buffer than in the watershed as a whole. For Sycamore, there was a 14% increase in canopy cover in a mere 4 years. Milwaukie had a 4% gain and Regner notched a 2% gain, a change from when canopy cover was analyzed in the entire Regner basin rather than having a 100 meter parameter.
3. Ecological Restoration
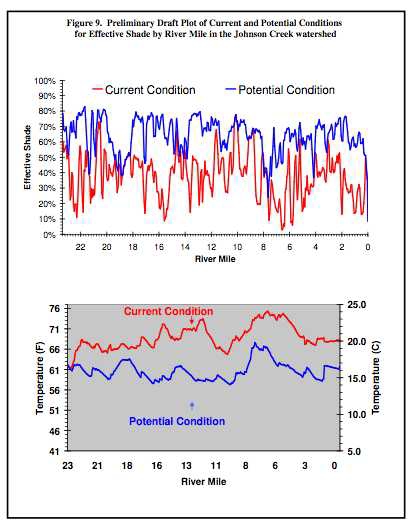
Vegetated riparian zones are narrow, minimal or lacking throughout much of the watershed. Johnson creek was calculated to have only 40% of its cover still intact (The Conservation Registry, 2002). Analysis has shown that for salmon and trout to thrive in Johnson Creek, the stream channels shaded area needs to reach 80% (Dent et al., 2005). To reach this goal they are trying to plant trees at all points possible along the stream banks. The amount of potential shading condition is shown in <Figure 15>.
The reference condition for the riparian zone is a continuous corridor of 91 meters, composed of mature native vegetation, with <2 stream crossings/ KM of stream length (The Conservation Registry, 2012a). Of the 179 acres within the riparian corridor, approximately 61 acres (34%) are developed urban areas including streets, yards, buildings, and parking lots. So far approximately 40 acres have been planted in the past 5 years. Unfortunately our analysis shows that this warming trend continues during the period of our study, 2000-2010, and that restoration efforts have yet to lower the creeks temperature.
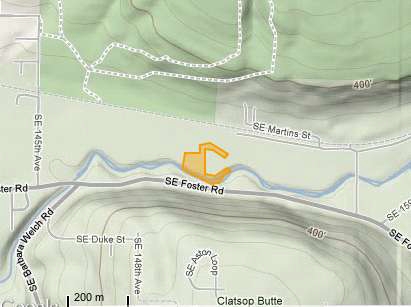
The first site referenced was the Sycamore Gauge Restoration <Figure 16>. There were two separate projects at this site, both formerly private residences. The objective for the first site was to remove a home, while enhancing and restoring the functional ecological values of the site (The Conservation Registry, 2012b). Once the structures were removed from the site, the Watershed Revegetation Program (WRP) began work in 2001. 2520 native trees and shrubs were installed in the project area, along 76 meters of stream-bank. After three years of maintenance and monitoring, the desired plant density levels had been reached. As of 2006, Japanese knotweed and garlic mustard were present along the stream-bank and were treated. As of 2011, no knotweed was detected though garlic mustard was still apparent on the property to the east. Himalayan blackberry was a minor problem, but due to lack of treatment, by 2011 blackberry had encroached significantly into the planted area, with vines growing over plantings. Even with the invasive species overshadowing the plantings, the survival of plantings has been high (The Conservation Registry, 2012b). Although the plants are surviving and a thick patch of young alders are present, our analysis shows no correlation between the project and the temperature of the creek.
The project on the adjacent “C” shaped property to the east has a successful establishment of native vegetation. The WRP planted 1500 native trees and 500 native shrubs along 150 meters of stream-bank in 1998. As of 2006, since the plants were well-established and the five-year commitment to maintenance and monitoring had transpired, the project was no longer maintained by the WRP. Portland Public Parks and Recreation took over maintenance. As of 2011, native vegetation was still present, although the untreated area inside of the “C” was covered by 3 m tall blackberry that was aggressively encroaching into the planted area (The Conservation Registry, 2012c). The Johnson Creek Watershed Council (JCWC) again needs to intervene to help guide the maintenance of the restored area so the natural plantings are able to grow large enough to establish their own sustainable ecosystem.
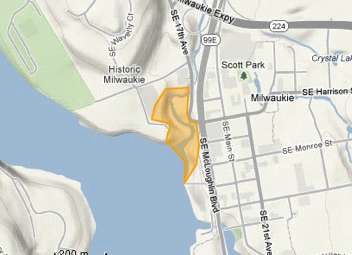
The second reference site is located just up from and including the confluence of Johnson creek with the Willamette River <Figure 17>. The project reach extends 411.5 meters from the 17th Street Bridge downstream to the mouth of Johnson Creek (The Conservation Registry, 2012d). This confluence area supports juvenile rearing and adult migration of federally listed Chinook, coho, and steelhead. However, due to decades of urban development, the reach is heavily degraded. Stream banks have been armored and confined, large wood and riparian forests have been removed, former floodplains have been filled and are crisscrossed with sewer and electric infrastructure, and until the 1960’s, the Portland-Milwaukie Streetcar crossed Johnson Creek at this site. Over the past 10 years, JCWC has worked with landowners along the project reach to conduct riparian restoration projects. In 2003 they installed 1,600 native trees and shrubs and planted 200 shrub cuttings in the stream bank, and 520 native trees and shrubs the next year (The Conservation Registry, 2012e). In winter 2012, community volunteers planted native trees, shrubs, and seeded wild flowers in disturbed areas within the six acres of adjacent riparian forests. The goal of this restoration is to inspire and facilitate community investment in the Johnson Creek Watershed for the protection and enhancement of its natural resources (Larson et al., 2010; JCWC, 2012b).
The site has had mixed levels of plant survival. In the second year of monitoring it was observed that beaver had significantly damaged the plantings in an area that extended 7.62 m. up the slope from the creek. Despite the varying levels of survival within the project area, the WRP’s plant density targets have been achieved for this project. Invasive species treatment and control has been a constant part of the restoration efforts at this site. Appendix photographs 1-3 show the restoration results.
4. Water Quality
The headwaters of Johnson Creek are in agricultural areas in the Cascade foothills, and along its 26-mile course the lands surrounding the creek change quickly from agricultural, to residential, to densely urbanized industrial. Management of stormwater runoff differs both between and within land use types. For example, in the eastern portion of the watershed, although mainly agricultural, many of these lands manage runoff through a series of ditches and drains, which act similarly to the networks of storm drains common in urban areas in their efficiency of stormwater delivery to streams. In urban areas, stormwater management ranges from storm drains directly connecting runoff from urbanized impervious land cover into Johnson Creek to storm drain networks that either route runoff out of the basin entirely (e.g. Portland’s combined sewer) or into management systems designed to allow for infiltration (such as dry wells, “green streets”, and pervious pavement).
In the course of urban development, sources of sediment for entering a stream decline after the construction phase (Paul and Meyer, 2001); however the history of the Johnson Creek watershed is such that most of the infrastructure from urban and agricultural development was in existence before hydrologic data collection began in 1941. For this reason, hydrologic trends associated with urbanization (more frequent, higher volume storm events, flashier hydrograph) were not detected from 1941-2006 in Johnson Creek (Lee and Synder, 2009). Major sources of sediment within Johnson Creek can then be assumed to originate in agricultural areas in the upper watershed.
Sedimentation is recognized by the EPA as one of the most pervasive water quality problems faced by streams in the United States (EPA, 2002). The major concern regarding sedimentation in Johnson Creek is the effect it has on salmon spawning, as the presence of fine sediments can reduce the survival rate of salmon spawn. Pollutants can also attach themselves to soil particles, and in the case of Johnson Creek, research has shown that DDT continues to be present in the stream decades after its abolition (JCWC, 2005a). The Oregon Department of Environmental Quality has judged that the best way to manage DDT in Johnson Creek is to reduce the level of Total Suspended Solids (TSS) in the stream (Brown and Caldwell, 2009).
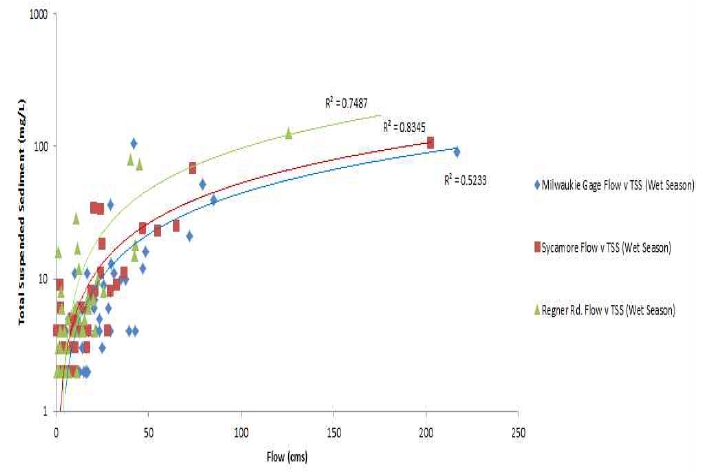
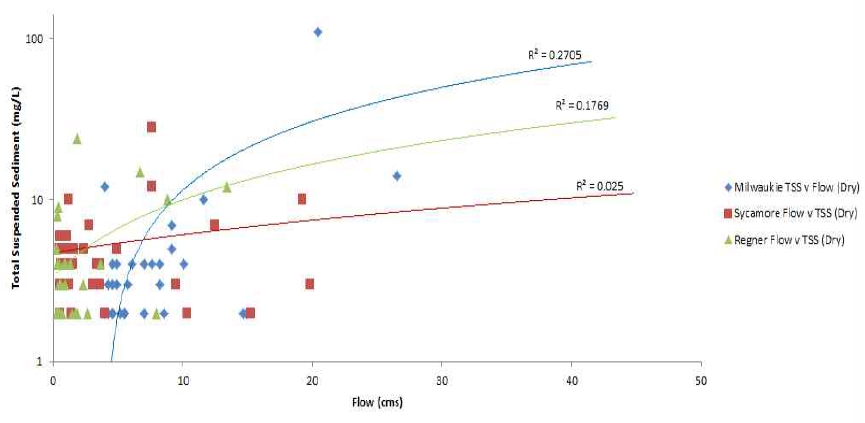
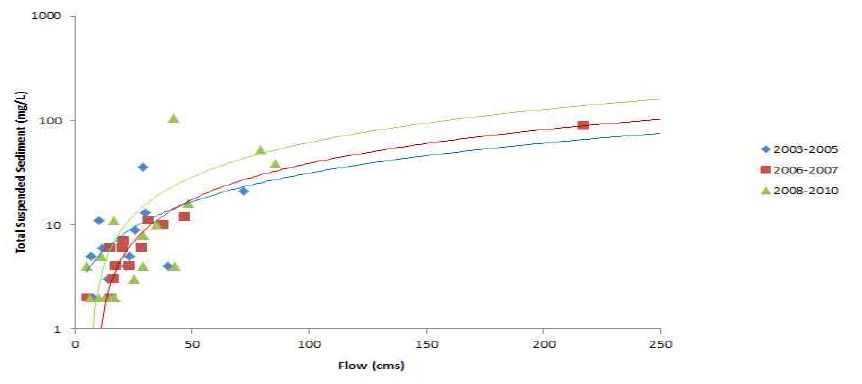
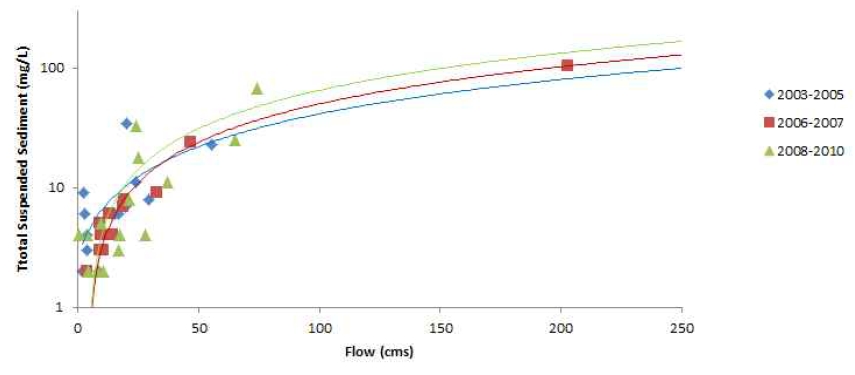
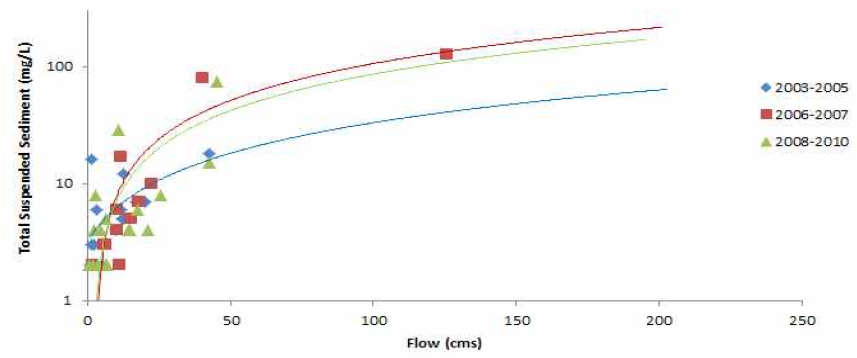
Sediment transport in Johnson Creek is driven by wet-season rains (defined here as November 1-April 30), which is demonstrated by a strong correlation between TSS and Flow during the wet season <Figure 18>. Low TSS and flow amounts during the dry-season (May 1-October 31) reveal that total sediment transport during the wet-season also dwarfs dry-season transport <Figure 19>. These findings are supported by recent USGS analysis (Stonewall and Bragg, 2012) which found that from 2007-2010, 70% of suspended sediment in Johnson Creek was transported in the months of November, December, and January. For this reason, analysis of TSS in Johnson Creek was based on wet-season TSS data.
Spatial analysis shows that flow has a greater impact on suspended sediment at upstream gages, which support the hypothesis that agricultural lands in the upper watershed are the major source of suspended sediment in Johnson Creek <Figure 18>.
Temporal analysis yielded the finding that between the years of 2003-2010, flow is clearly having an increasingly greater impact on suspended sediment within Johnson Creek (<Figures 20-22>). At each of the three gages, equal flows are resulting in higher TSS readings in the years 2006-2010 than in 2003-2005. At both the Sycamore and Milwaukie gages, this relationship increases with each subsequent time period. At Regner Rd., located in the upper watershed, this trend reversed itself during the 2008-2010 period, however was still significantly greater than 2003-2005. This finding would indicate that between 2007-2010, sources for sediment decreased in the upper watershed.
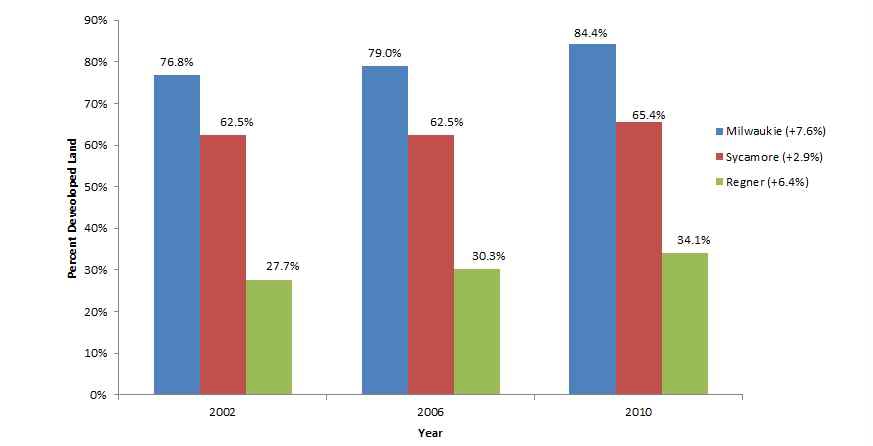
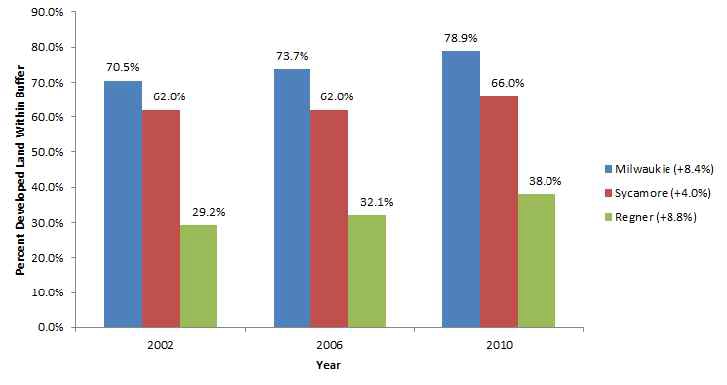
Analysis of development within the Johnson Creek strom-watershed demonstrates that significant areas of both the upper and lower strom-watersheds were developed between 2003-2010, while development occurred at a slower rate in the middle strom-watershed<Figure 23>. Within 100 meters of the creek and its tributaries, analysis showed that rates of development were again highest in the upper and lower strom-watersheds and slower within the middle strom-watershed <Figure 24>.
Ⅴ. Conclusions
As discussed above, this researcher has concluded that a significant cause of stream temperature warming is increased solar radiation loads on streams due to human-generated disturbances to near-stream vegetation. McConnaha (2003) stated that maximum temperatures collected by the City of Portland ranged from 15.8 to 24.3°C, with a mean maximum of 18.2°C. Our result also indicated poor water quality with high water temperature as previous scholars have done. Furthermore, the predominance of numerical and visual evidence indicates that the most important human-caused effects on stream temperatures include increased direct sun exposure on a body of water and streamside heating as a result of the removal or thinning of streamside vegetation. One that the watershed authority need to pay attention to is an increase in annual averaged daily maximum stream temperature volumes.
The increase in forest canopy within the sub-basins could indicate the restoration projects done between 2002 and 2006 in Sycamore and Milwaukie were successful in restoring canopy cover but further data is needed to determine whether restoration projects alone could account for the increase in canopy cover within Johnson Creek and what other factors might have played a role in the sudden increase in the percentage of canopy cover. Sycamore’s large percentage increase raises a few questions about whether the source of the data provided the best accuracy and whether other factors might have played a role. Both analyses of the sub-basin as a whole and the buffer showed Sycamore gaining in forest canopy. One consideration is the vegetation grown in the area and whether the natural growth patterns would provide a feasible explanation of restoration projects contributing to an increase in canopy cover.
While this study did find stream flow to have increasing impact over time within the Johnson Creek watershed, development metrics employed by this author did not explain this effect. The change in TSS/flow relationship in the upper watershed between 2006-2010, which showed a decrease in the impact of flow on sediment, was also not explained by the development data. There are a number of possible explanations for this finding, including the limited utility of the RLIS development dataset, which operates at a scale that doesn’t pick up mixed land-use in areas under 0.5 acres in size (Metro Data Resource Center, 2008). Therefore, lots that are 0.5 acres or less and contain one building but are otherwise forested would be considered “developed” by this metric. RLIS data is also of limited use for the consideration of stormwater and other ecosystem-related concerns, as it considers certain land uses, such as parks and open spaces as developed (as they are off limits to developers) despite their obvious state of limited or non “developedness”. Future research should consider other metrics, including the National Land Cover Database (NLCD).
Management decisions within land use categories may also have an impact on the TSS/Flow relationship that will not be apparent with the use of other development metrics, including the NLCD. For instance, within agricultural areas, planting and tilling decisions made each year could have differing impacts, depending on the timing of storm events.
Another limitation of this research is that due to the infrequent nature of TSS sampling in Johnson Creek only 48 wet-season samples were available, capturing few storm events and not providing a large enough sample size, both across the 2003-2010 time span and within each individual year. This speaks to the common refrain among stream researchers that greater investments in data collection are needed in order to make conclusions about the drivers of water quality in all watersheds, including urbanized watersheds like Johnson Creek.
In conclusion, for the longevity of the restoration process and the health of the trees, protecting the remaining native riparian vegetation in the Johnson creek watershed is an important part of maintaining and restoring the natural functions of the watershed. Once natural functions and resource areas are lost to development and conditions have been degraded, it becomes much harder to re-establish natural ecosystems of these lands. Protecting healthy natural areas is the first step in restoring natural functions to the watershed as a whole. Johnson Creek is already in a degraded state and cannot afford to lose any additional natural functions (JCWC 2012a). Through the experience gained educating ourselves through the restoration process and data analysis, we will better be equipped to avoid repeating the mistakes that have been made in the past, and be able to use adaptive management to allow nature to again be natural.
References
-
Alberti, M., 2005, “The effects of urban patterns on ecosystem function,” International Regional Science Review, 28(2), pp.168-192.
[https://doi.org/10.1177/0160017605275160]

-
Arnold, C. L. and C. J. Gibbons, 1996, “Impervious surface coverage—The emergence of a key environmental indicator,” Journal of the American Planning Association, 62(2), pp.243–258.
[https://doi.org/10.1080/01944369608975688]

-
Arnold, C. L., P. J. Boison, and P. C. Patton, 1982, “Sawmill brook: An example of rapid geomorphic change related to urbanization,” Journal of Geology, 90(2), pp.155-166.
[https://doi.org/10.1086/628660]

-
Bolstad, P. V. and W. T. Swank, 1997, “Cumulative impacts of landuse on water quality in a southern appalachian watershed,” JAWRA Journal of the American Water Resources Association, 33(3), pp.519-533.
[https://doi.org/10.1111/j.1752-1688.1997.tb03529.x]

- Brown and Caldwell, 2009, Willamette river watershed total maximum daily load implementation plan, Portland: Brown and Caldwell, Available at http://www.clackamas.us/wes/documents/swm/TMDLWillamettteDraft.pdf, .
-
Chang, H., 2007, “Comparative streamflow characteristics in urbanizing basins in the Portland Metropolitan Area, Oregon, USA,” Hydrological Processes: An International Journal, 21(2), pp.211-222.
[https://doi.org/10.1002/hyp.6233]

-
Chang, H. and T. Carlson, 2005, “Water quality during winter storm events in spring creek, Pennsylvania USA,” Hydrobiologia, 544(1), pp.321-332.
[https://doi.org/10.1007/s10750-005-1894-6]

- Dent, L., H. Salwasser, and G. Achterman, 2005, Environmental indicators for the Oregon plan for salmon and watersheds, Corvalis, Oregon: Oregon State University, Available at http://ir.library.oregonstate.edu/xmlui/handle/1957/129, .
- DEQ, 2010, Environmental cleanup site information (ECSI) database site summary full report, Portland OR: DEQ, https://www.deq.state.or.us/lq/ECSI/ecsidetailfull.asp?seqnbr=4451, .
- Environmental Protection Agency, 2002, 2000 national water quality inventory, Washington, D.C.: EPA Office of Water, Available at http://water.epa.gov/lawsregs/guidance/cwa/305b/2000report_index.cfm, .
-
Grimm, N. and R. Sheibley, 2005, “N retention and transformation in urban streams,” Journal of the North American Benthological Society, 24(3), pp.626-642.
[https://doi.org/10.1899/04-027.1]

-
Hatt, B. E., T. D. Fletcher, C. J. Walsh, and S. L. Taylor, 2004, “The influence of urban density and drainage infrastructure on the concentrations and loads of pollutants in small streams,” Environmental Management, 34(1), pp.112-124.
[https://doi.org/10.1007/s00267-004-0221-8]

-
Isaak, D. J., C. H. Luce, B. E. Rieman, D. E. Nagel, D. L. Horan, and S. Parkes et al., 2010, “Effects of climate change and wildfire on stream temperatures and salmonid thermal habitat in a mountain river network,” Ecological Applications, 20(5), pp.1350-1371.
[https://doi.org/10.1890/09-0822.1]

- JCWC, 2003, Water quality, Johnson creek watershed action plan: An daptive approach, (pp.34-41), Portland, OR: Johnson Creek Watershed Council.
- JCWC, 2005a, Johnson creek watershed characterization, Portland, OR: Johnson Creek Watershed Council.
- JCWC, 2005b, Johnson creek legacy pesticide study 2003-2005, Milwaukie, OR: Johnson Creek Inter-jurisdictional Committee.
- JCWC, 2012a, State of the watershed, Milwaukie, Oregon: Johnson Creek Watershed Council, Available at http://jcwc.org/wp-content/uploads/2012/05/2012StateoftheWatershed.pdf, .
- JCWC, 2012b, Restoration, Milwaukie, Oregon: Johnson Creek Watershed Council, Available at http://jcwc.org/restoration/, .
-
Jones, J. A., 2000, “Hydrologic process and peak discharge response to forest removal, regrowth, and roads in 10 small experimental basins, Western Cascades, Oregon,” Water Resources Research, 36(9), pp.2621–2642.
[https://doi.org/10.1029/2000WR900105]

-
Kauffman, G. J. and A. C. Belden, 2010, “Water quality trends (1970 to 2005) along Delaware streams in the Delaware and chesapeake bay watersheds, USA,” Water, Air, and Soil Pollution, 208, pp.345-375.
[https://doi.org/10.1007/s11270-009-0172-z]

- Koehler, K., 2004, Framework for integrated management of watershed health: Appendix e-The city’s natural environment, Oregon: The City of Portland, https://darkwing.uoregon.edu/~dtodd/WilRiver/Koehler1.htm, .
-
Lalli, C. and T. R. Parsons, 1997, Biological oceanography: An introduction, Burlington, MA: Elsevier.
[https://doi.org/10.1016/B978-075063384-0/50001-3]

- Larson, K. and D. Lach, 2010, “Equity in urban water governance through participatory, place-Based approaches,” Natural Resources Journal, 50(2), pp.407-430.
-
Lee, K. K. and D. T. Synder, 2009, Hydrology of the Johnson creek basin, Oregon, (Scientific Investigations Report 2009-5123), Reston, VA.: U.S. Geological Survey.
[https://doi.org/10.3133/sir20095123]

-
Leopold, L. B., 1968, Hydrology for urban land use Planning: A guidebook on the hydrologic effects of urban land use, Washington, D.C.: U.S. Geological Survey.
[https://doi.org/10.3133/cir554]

-
Levell, A. and H. Chang, 2008, “Monitoring the channel process of a stream restoration project in an urbanizing watershed: A case study of Kelley Creek, Oregon, USA,” River Research and Applications, 24(2), pp.169-182.
[https://doi.org/10.1002/rra.1050]

- MacRae, C. R., 1997, Toward an understanding of the geomorphology of urban streams, Toronto: Aquafor Beech Limited.
- McConnaha, W. E., 2003, “Assessment of coho salmon Habitat in an urban stream using species-Habitat analysis,” PhD. Dissertation, Portland State University, Portland, OR.
- Metro Data Resource Center, 2008, RLIS discovery data, Portland OR: Metro Regional Government, http://rlisdiscovery.oregonmetro.gov/?resourceID=6#, .
-
Morrill, J. C., R. C. Bales, and M. H. Conklin, 2005, “Estimating stream temperature from air temperature: Implications for future water quality,” Journal of Environmental Engineering, 131(1), pp.139-146.
[https://doi.org/10.1061/(ASCE)0733-9372(2005)131:1(139)]

- ODEQ, 2010, Oregon water quality index, Oregon department of environmental quality report 2010, (pp.2-7), State of Oregon: ODEQ, http://www.deq.state.or.us/lab/wqm/docs/12-LAB-002.pdf, .
-
Paul, M. J. and J. L. Meyer, 2001, “Streams in the urban landscape,” Annual Review of Ecology and Systematics, 32, pp.333–365.
[https://doi.org/10.1146/annurev.ecolsys.32.081501.114040]

-
Roering, J. J., K. M. Schmidt, J. D. Stock, W. E. Dietrich, and D. R. Montgomery, 2003, “Shallow land-sliding, root reinforcement, and the spatial distribution of trees in the Oregon Coast Range,” Canadian Geotechnical Journal, 40(2), pp.237-253.
[https://doi.org/10.1139/t02-113]

- Roth, W. M., 2002, Henderson creek, In L. M. Richter and R. Engelhart (Eds.), Life of science: Whitebook on educational initiatives in natural sciences and technology, (pp.155-166), Copenhagen: Learning Lab Denmark.
-
Roth, T. R., M. C. Westhoff, H. Huwald, J. A. Huff, J. F. Rubin, and G. Barrenetxea et al., 2010, “Stream temperature response to three riparian vegetation scenarios by use of a distributed temperature validated mode,” Environmental Science & Technology, 44(6), pp.2072-2078.
[https://doi.org/10.1021/es902654f]

-
Roy, A. H., M. C. Freeman, B. J. Freeman, S. J. Wenger, W. E. Ensign, and J. L. Meyer, 2005, “Investigating hydrologic alteration as a mechanism of fish assemblage shifts in urbanizing streams,” Journal of the North American Benthological Society, 24(3), pp.656-678.
[https://doi.org/10.1899/04-022.1]

-
Sinokrot, B. and H. Stefen, 1993, “Streem temperature dynamics: Mesearments and modeling,” Water Resources Research, 29, pp.2299-2312.
[https://doi.org/10.1029/93WR00540]

-
Stepenuck, K. F., R. L. Crunkilton, and L. Wang, 2002, “Impacts of urban landuse on macroinvertebrate communities in southeastern Wisconsin streams,” Journal of the American Water Resources Association, 38(4), pp.1041-1051.
[https://doi.org/10.1111/j.1752-1688.2002.tb05544.x]

-
Stonewall, A. J. and H. M. Bragg, 2012, Suspended-sediment characteristics for the Johnson creek basin, Oregon, water years 2007–10, (Scientific Investigations Report 2012-5200), Reston, VA: U.S. Geological Survey.
[https://doi.org/10.3133/sir20125200]

- The Conservation Registry, 2002, The action plan, Milwaukie, Oregon: Johnson Creek Watershed Council, Available at https://nrimp.dfw.state.or.us/web%20stores/data%20libraries/files/Watershed%20Councils/Watershed%20Councils_164_DOC_JohnsonCreekWSActionPlan.pdf, .
- The Conservation Registry, 2012a, An assessment and inventory of riparian restoration and enhancement projects in the Johnson creek watershed, In Kendra Petersen-Morgan, 2006, for Johnson Creek Watershed Council and Portland State University, Milwaukie, Oregon: Johnson Creek Watershed Council, Available at http://jcwc.conservationregistry.org/assets/0000/6770/2006_Assessment_by_Kendra.pdf, .
- The Conservation Registry, 2012b, Sycamore gauge restoration, Milwaukie, Oregon: Johnson Creek Watershed Council, Available at http://jcwc.conservationregistry.org/projects/15337, .
- The Conservation Registry, 2012c, Sycamore gauge restoration, Milwaukie, Oregon: Johnson Creek Watershed Council, Available at http://jcwc.conservationregistry.orgassets0000/6765/2011_Sycamore_Gauge_Reveg_Survey_Results.pdf, .
- The Conservation Registry, 2012d, Johnson creek Willamette river confluence and Klein point, Milwaukie, Oregon: Johnson Creek Watershed Council, Available at http://jcwc.conservationregistry.org/assets/0000/5134/Johnson_Creek_Willamette_Confluence.pdf, .
- The Conservation Registry, 2012e, Johnson creek Willamette river confluence and Klein point, Milwaukie, Oregon: Johnson Creek Watershed Council, Available at http://jcwc.conservationregistry.org/assets/0000/5183/Klein_Point.pdf, .
-
Walsh, C. J., A. H. Roy, J. W. Feminella, P. D. Cottingham, P. M. Groffman, and R. P. Morgan, 2005, “The urban stream syndrome: Current knowledge and the search for a cure,” Journal of the North American Benthological Society, 24(3), pp.706-725.
[https://doi.org/10.1899/04-028.1]

-
Walton, B. M., M. Salling, J. Wyles, and J. Wolin, 2007, “Biological integrity in urban streams: Toward resolving multiple dimensions of urbanization,” Landscape and Urban Planning, 79(1), pp.110-123.
[https://doi.org/10.1016/j.landurbplan.2005.10.004]

-
Wang, L. and J. Lyons, 2003, Fish and benthic macroinvertebrate assemblages as indicators of stream degradation in urbanizing watersheds, In T. P. Simon, (ed.), Biological response signatures: Indicator patterns using aquatic communities, (pp.227-249), Boca Raton: CRC Press.
[https://doi.org/10.1201/9781420041453.ch13]

Chang-Yu Hong: Chang-Yu Hong is a research fellow at the Jeju Research Institute. Ph.D. in Urban Studies from the College of Urban and Public Affairs of Portland State University. His area of concentration is urban and regional policy analysis by adopting theorectic models such as Socio-Ecological Systems and Socio-Hydrology (503changyu@gmail.com).
